
Figure 2. Evaluation of the best number of clusters.
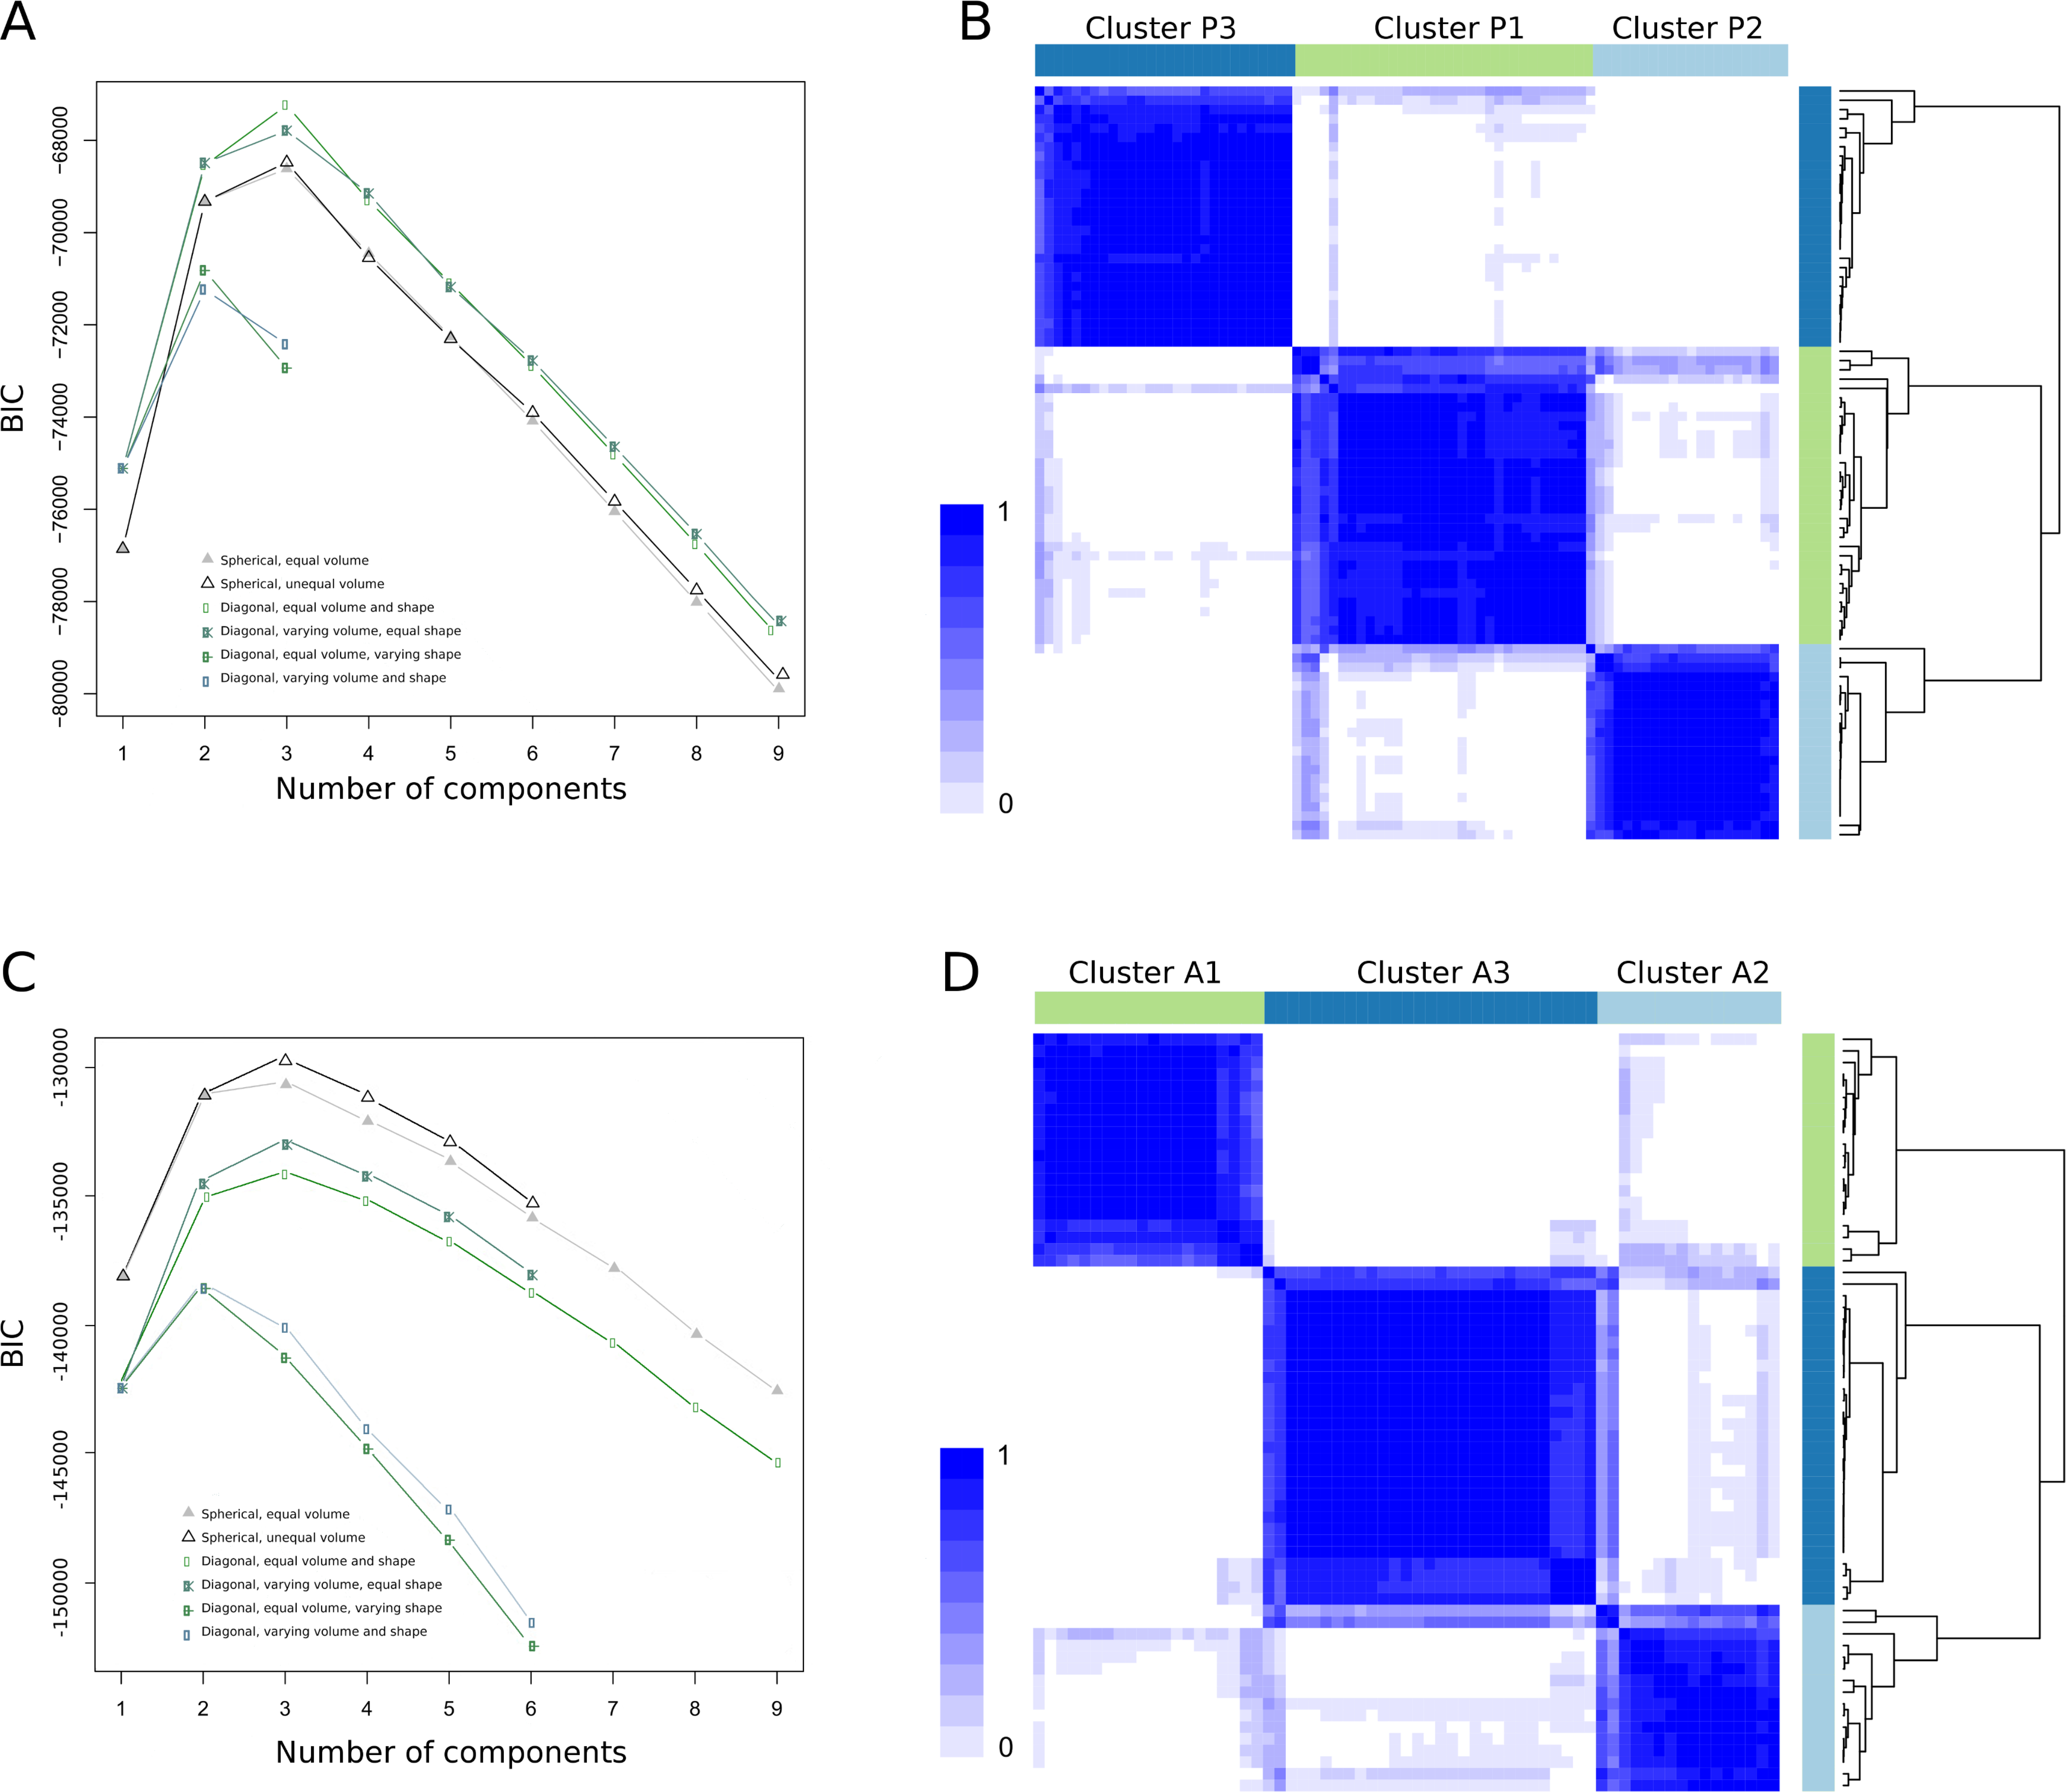
A) The plot shows the BIC values in y-axis and number of clusters in x-axis. The optimal number of clusters was three, value at which we found the highest BIC value. B) Stratification of pediatric patients using ConsensusClusterPlus R package. Rows and columns represent patients in the same order and color intensity represent the probability of that two patients clustering together. C) Estimation of the optimal number of clusters for the adult patient set, resulting in 3as the best number of clusters. D) Stratification of the adult patients.