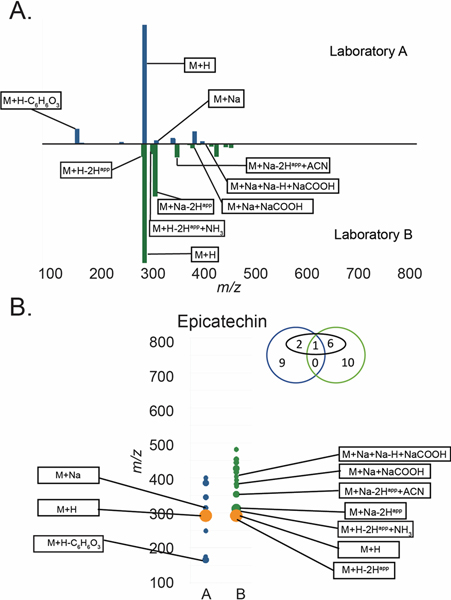
Figure 4.

A) Butterfly plot of MS features for epicatechin in both laboratories and B) a simplified view of the butterfly plot in panel A. For panel B orange = features present in both datasets, blue = features only present in Laboratory A, green = features only present in Laboratory B. Diameter is proportional to the relative intensity of each datapoint. The Venn diagram above the trace indicates the number of features from Laboratory A (blue) or Laboratory B (green). Features in black boxes were annotatable adducts or fragments (e.g. [M+H]+, [M+Na]+, [M+H-H2O]+ etc.). Interpretation of the Venn Diagram for epicatechin is as follows: 12 and 17 features were grouped with the molecule for Laboratories A and B respectively. Four of the epicatechin-associated features in the dataset for Laboratory A and seven of the epicatechin-associated features in the dataset for Laboratory B were annotatable, as adducts or clusters (numbers in black circle). Only one of the epicatechin-associated features was detected by both Laboratory A and Laboratory B, and none (zero) of the unidentified peaks were present in both datasets.
