
Figure 1.
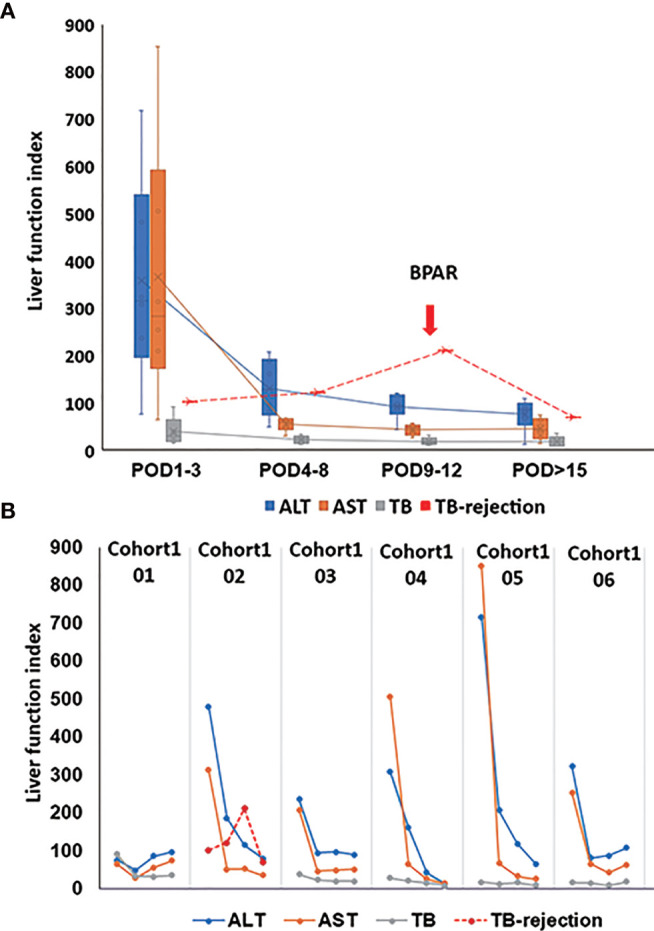
Post-transplant liver function. (A) The change of average ALT, AST, and TB from POD1 to POD>15. The red line of TB rejection presents the change of TB for the patient with BPAR; BPAR occurred in the combination of high TB. (B) The presentative liver function from six out of seven patients in cohort1. For patient02 in cohort1, his transaminase increased with a peak AST level at 785 U/L on POD1 and gradually decreased. However, his TB level continued to grow after the surgery. On POD 10, his TB reached 309.8 μmol/L. As a possibility of BPAR was suspected, he underwent a puncture liver biopsy on POD 11. The pathological results suggested a mild acute rejection (rejection activity index, RAI=2+1+2 = 5). Simultaneously, a dose of 500 mg of methylprednisolone was given from POD 11, then tapered down and discontinued on POD 16. The patient’s TB level fell below 100 μmol/L and did not increase subsequently. ALT, alanine aminotransferase; AST, aspartate aminotransferase; TB, total bilirubin; biopsy-proven acute rejection (BPAR).