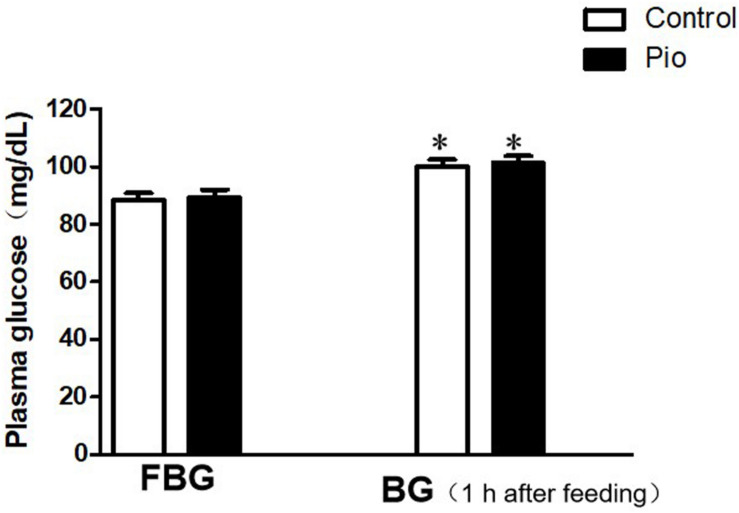
FIGURE 1.
Comparison of the plasma glucose levels before and 1 h after feeding. There were no significant differences in the plasma glucose levels before and 1 h after feeding between the control and pioglitazone-treatment group. Values are expressed as mean ± SE (n = 6). (FBG, fasting blood glucose; BG, blood glucose). Compared to FBG, ∗ represents p < 0.05.

