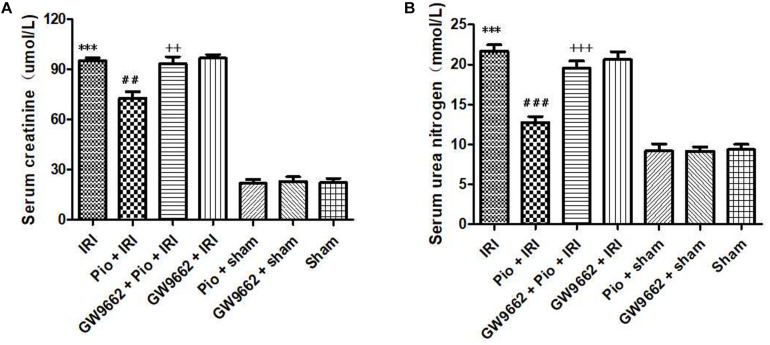
FIGURE 2.
Pioglitazone treatment improves renal IRI. (A) Serum creatinine levels in different groups at 24 h after renal IRI. (B) Serum urea nitrogen levels in different groups at 24 h after renal IRI. Values are expressed as mean ± SE (n = 6). Compared to the sham group, ∗∗∗ represents p < 0.001; compared to the IRI group, ## represents p < 0.01, and ### represents p < 0.001; compared to the Pio + IRI group, ++ represents p < 0.01, and +++ represents p < 0.001.

