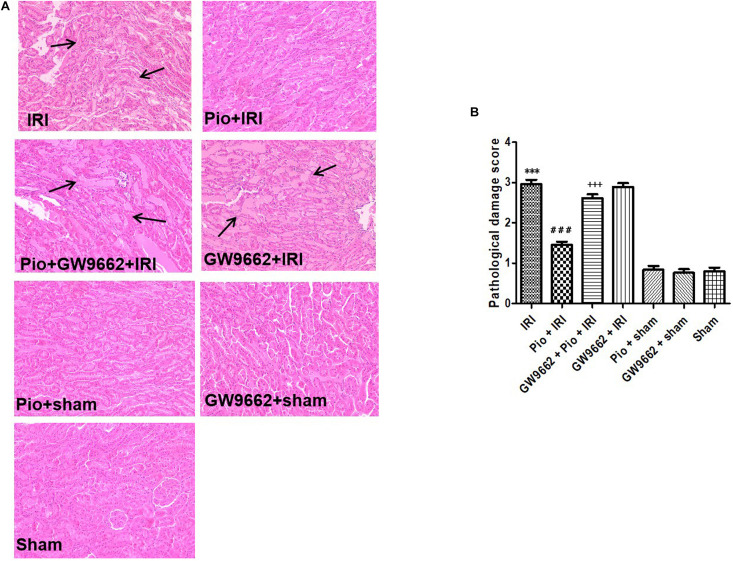
FIGURE 3.
Histological evaluation of the renal tissue at 24 h after renal IRI. (A) Representative photographs of kidney sections stained with hematoxylin and eosin (original magnification 200×). (B) Histological scoring of the kidney sections. Arrows indicate tubular dilatation, swelling, congestion, vacuolization, and tubular necrosis in the kidneys (n = 4). Compared to the sham group, ∗∗∗ represents p < 0.001; compared to the IRI group, ### represents p < 0.001; compared to the Pio + IRI group, +++ represents p < 0.001.

