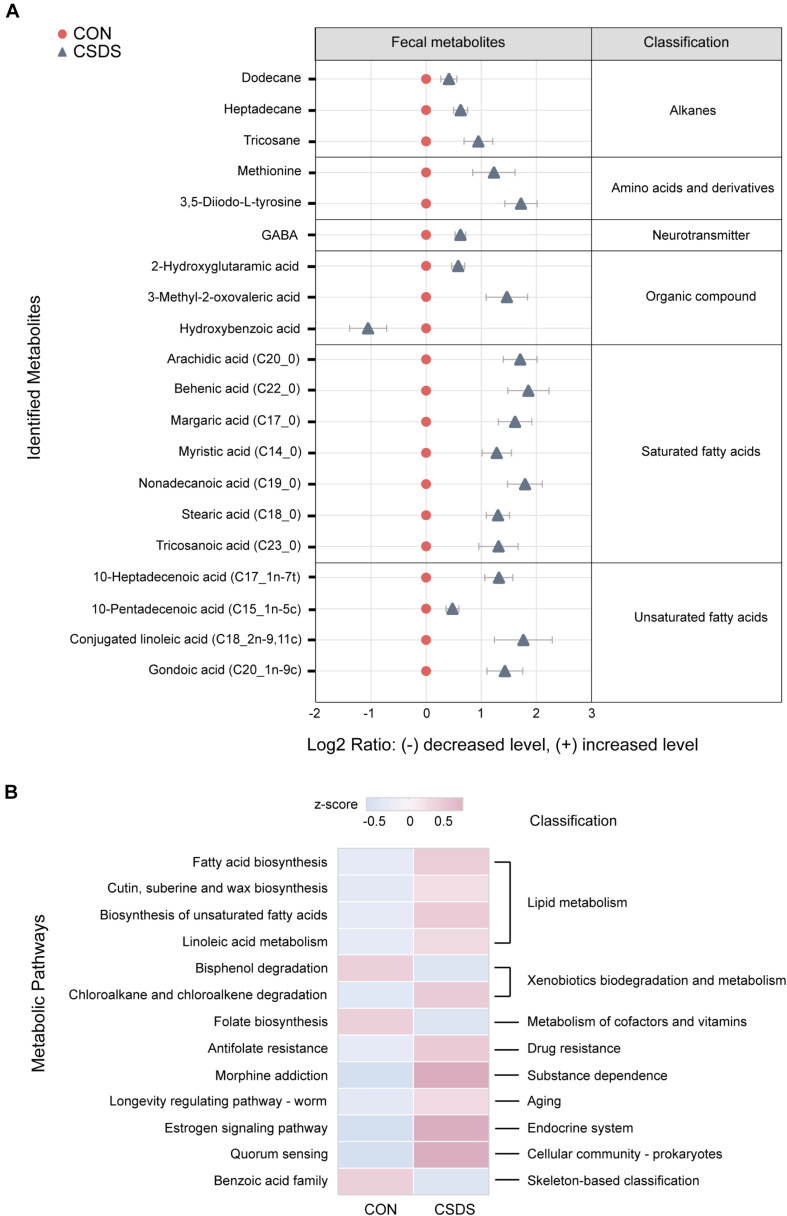
FIGURE 3.
Identification and pathway analysis of differential fecal metabolites between the control and CSDS mice. (A) 20 fecal metabolites were identified to be significantly changed in the CSDS mice. Compared to the control mice, only one metabolite (hydroxybenzoic acid) was significantly decreased, whereas the other 19 metabolites were increased in the CSDS mice. (B) Pathway analysis for fecal metabolites based on KEGG database revealed that 13 pathways were disturbed in the CSDS mice, of which most (4/13) were involved in lipid metabolism. CON, mice in the control group; CSDS, mice in the CSDS group.

