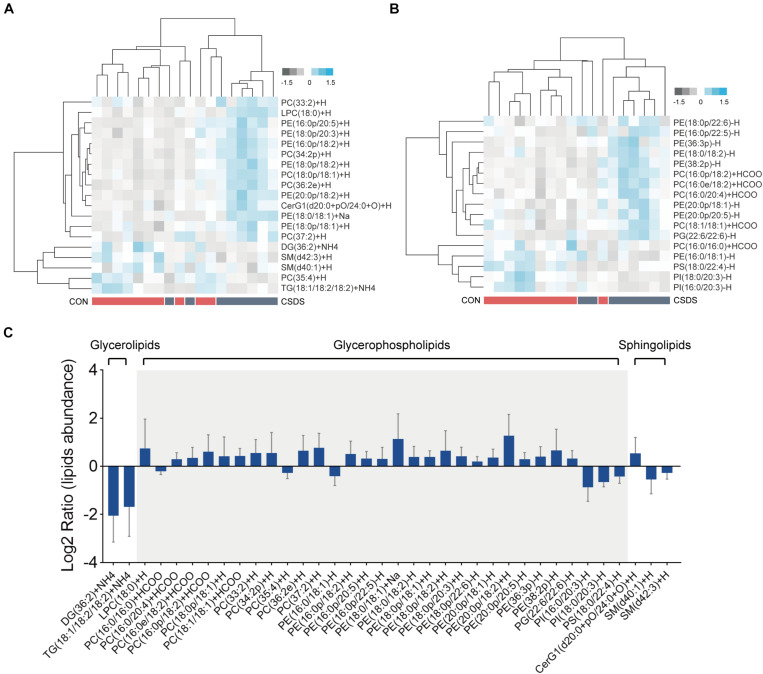
FIGURE 4.
Differential lipids identified in the colon tissues between the control and CSDS mice. (A) Heatmaps of 19 differential lipids identified in the positive mode and (B) 17 differential lipids identified in the negative mode. (C) These differential lipids belonged to glycerolipids, glycerophospholipids, and sphingolipids categories, of which most (31/36) were glycerophospholipids. CON, mice in the control group; CSDS, mice in the CSDS group.

