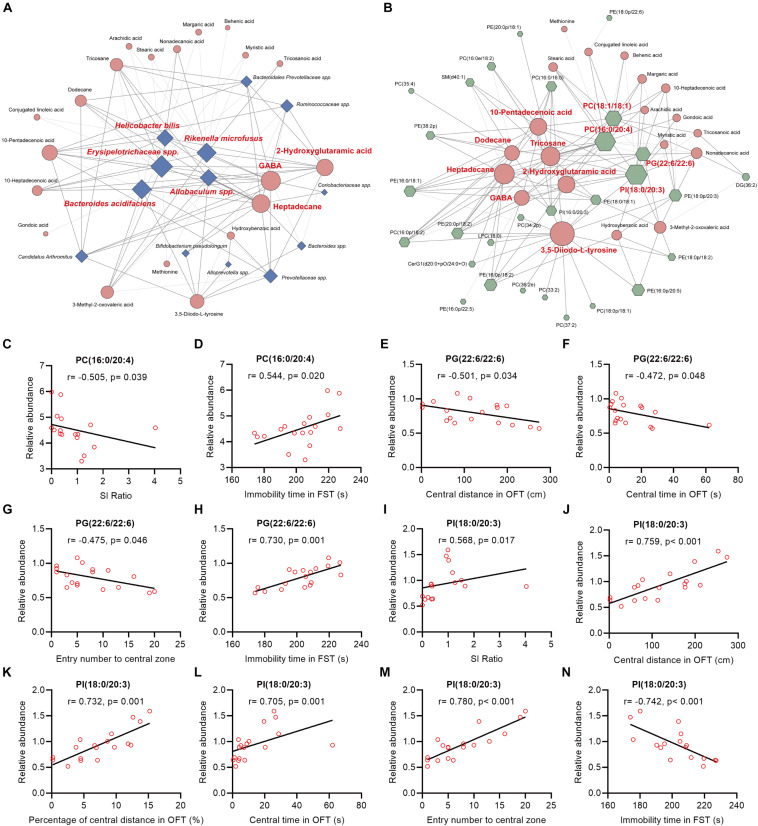
FIGURE 5.
Spearman’s correlations between the differential bacteria species, fecal metabolites, colonic lipids, and behavior indices. (A,B) The network maps illustrated correlations between the differential bacteria species and fecal metabolites, and between the differential fecal metabolites and colonic lipids, respectively. Blue nodes represent bacteria species; orange nodes represent fecal metabolites; and green nodes represent colonic lipids. Edges between nodes represent Spearman’s correlation. The node size corresponds to the number of correlations, that is, a larger node for bacteria taxa indicates it linked to more fecal metabolites. Nodes (the number of correlations over or equal to 10) were marked in red. The edge width corresponds to correlation coefficient. (C–N) The correlation analysis between PC(16:0/20:4), PG(22:6/22:6), PI(18:0/20:3), and behavioral index, respectively.

