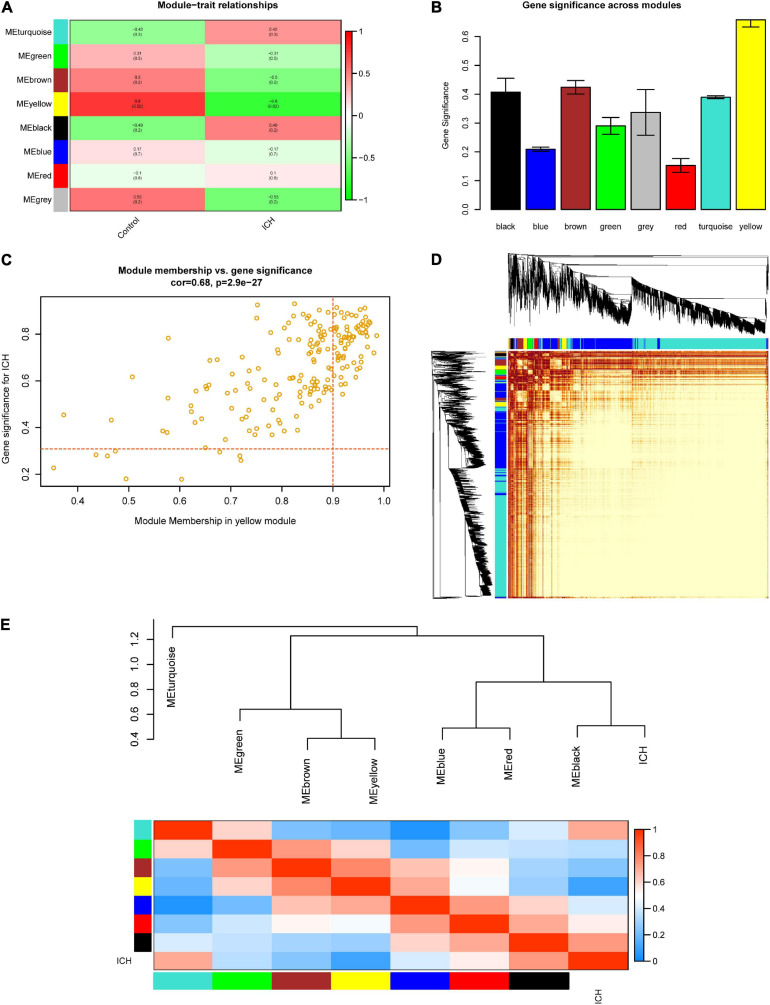
FIGURE 4.
Selection of the key module and visualization of the topological overlap matrix (TOM). (A) Module–trait relationships among the eight gene modules. (B) Gene significance (GS) across modules. The GS value of the yellow module was the highest. (C) Module membership (MM) vs. GS in the yellow module. The red dotted lines represent the thresholds of MM > 0.9 and GS > 0.3 set for interesting genes. (D) Heatmap showing the TOM among all 5,000 genes involved in the WGCNA. (E) Eigengene dendrogram and adjacency heatmap further clarify the correlation between intracerebral hemorrhage (ICH) and the modules.

