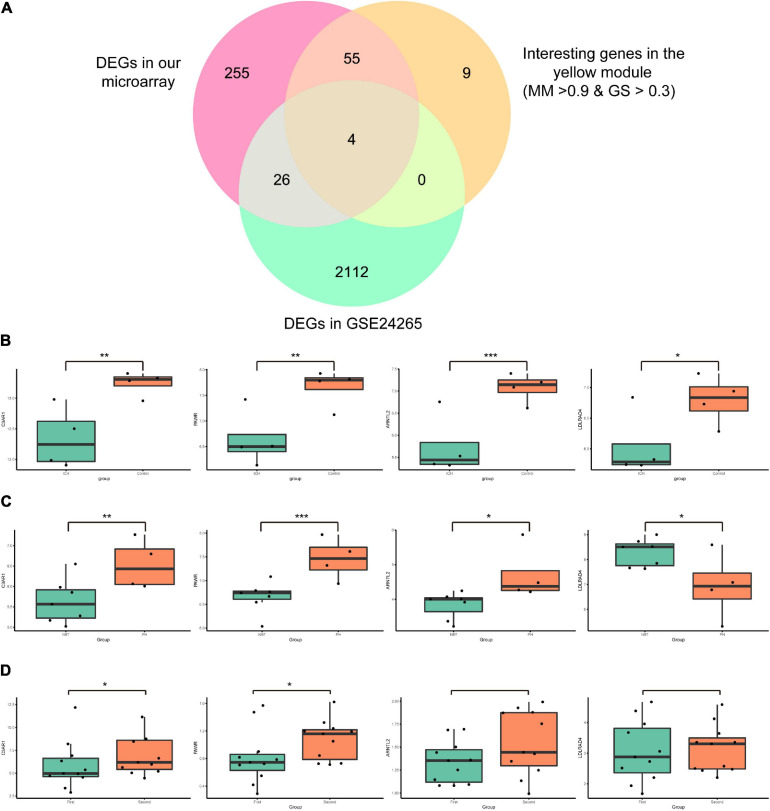
FIGURE 5.
Identification and expressions of the candidate messenger RNAs (mRNAs) in our microarray and those of GSE24265 and GSE125512. (A) Venn diagram showing four candidate mRNAs in the intersection of the 340 differentially expressed genes (DEGs) in our array, 68 interesting genes in the yellow module, and the 2,142 DEGs in GSE24265. (B) Box plots of the expressions of the candidate mRNAs in our microarray data. The green box represents the intracerebral hemorrhage (ICH) group and the red box represents the control group. (C) Box plots of the expressions of candidate mRNAs in GSE24265. The green box represents the normal brain tissue (NBT) group and the red box represents the perihematomal tissue (PH) group. (D) Box plots of the expressions of candidate mRNAs in GSE125512. The green box represents the first blood collection group (blood was collected within 24 h of onset) and the red box represents the second blood collection group (blood was collected within 72 h after the first blood draw). ***p < 0.001; **p < 0.01; *p < 0.05.

