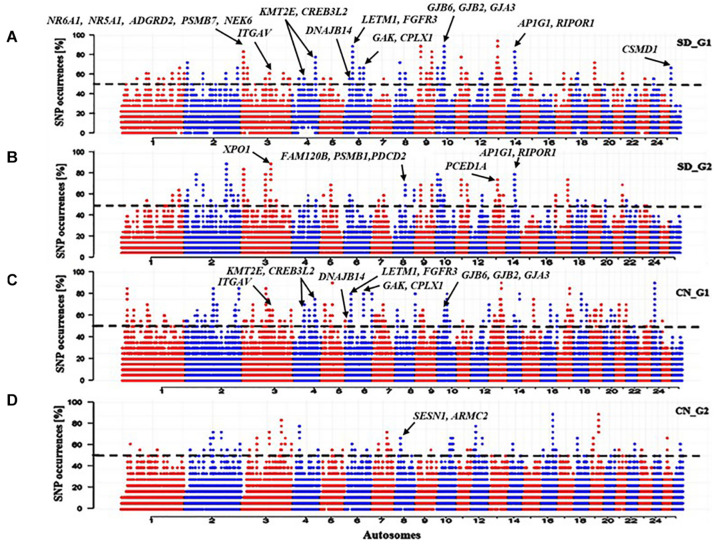
FIGURE 4.
Manhattan plots of genome-wide distribution frequency of SNPs in stretches of ROH regions for (A) SD_G1 genetic group of thin-tailed Desert Sheep from Sudan; (B) SD_G2 genetic group of thin-tailed Desert Sheep from Sudan; (C) CN_G1 genetic group of Chinese sheep; (D) CN_G2 genetic group of Chinese sheep. The dashed lines indicate the 50% cut-off threshold for each groups of individuals.

