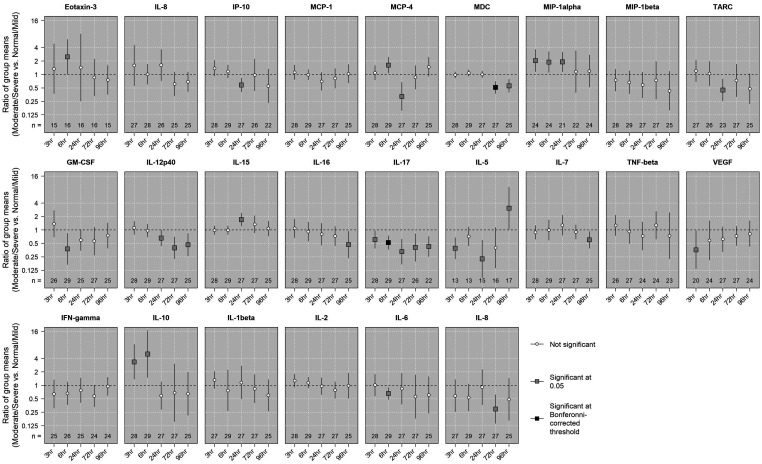
Figure 1.
Comparing mean concentrations by initial injury severity groups among study animals. The associations between the mean log-transformed concentration of each biomarker at each time point and initial injury group (moderate/severe vs. normal/mild) were assessed using linear regressions with robust standard errors. An estimated ratio >1 indicates that the mean concentration in the moderate/severe group was higher than the mean concentration in the normal/mild group, and vice versa. Statistical signficance was evaluated using both an undajusted level of 0.05 and a conservative Bonferroni-corrected level (0.05 divided by 120 tests).

