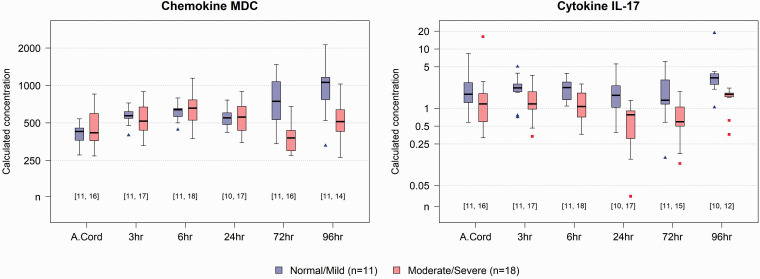
Figure 2.
MDC and IL-17 by initial injury severity over time. Distributions of MDC (left) and IL-17 (right) over time, including initial cord blood, by initial injury group. Numbers in square brackets indicate number of animals from which data was available at each time point in the Mild/Normal (first number) and Moderate/Severe (Second number) groups.

