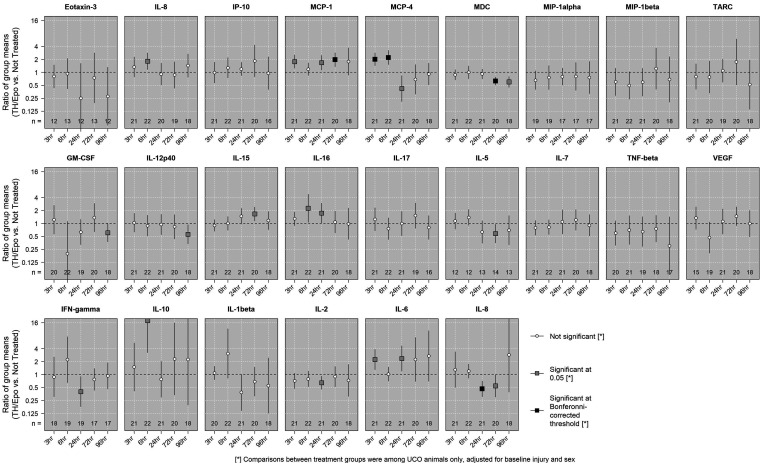
Figure 3.
Comparing mean concentrations in treatment groups among UCO animals. The associations between the mean log-transformed concentration of each biomarker at each time point and treatment group (TH/Epo vs untreated) among UCO animals were assessed using linear regressions with robust standard errors. An estimated ratio >1 indicates that the mean concentration in the TH/Epo group was higher than the mean concentration in the untreated group after adjustment for initial injury and sex. Statistical signficance was evaluated using both an undajusted level of 0.05 and a conservative Bonferroni-corrected level (0.05 divided by 120 tests).

