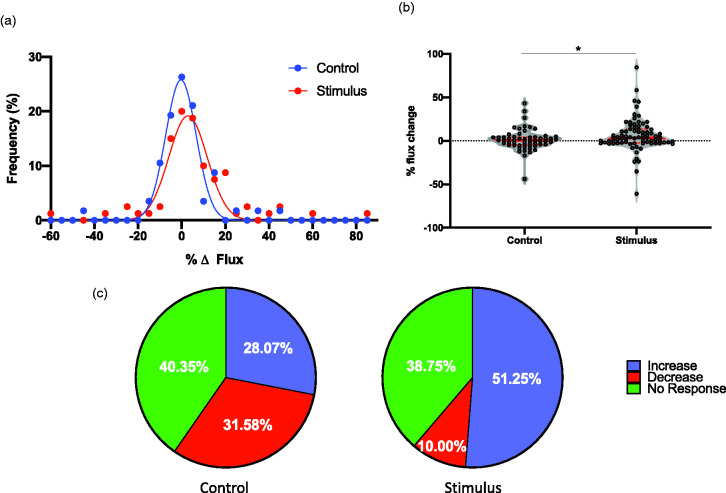
Figure 2.
Capillaries exhibit a network response to whisker stimulation. RBC flux, used as a surrogate measurement to capillary dilation (increased flux) and constriction (decreased flux), was measured in capillaries following 10-s whisker stimulation (n = 57 capillaries) as well as control (no stimulation; n = 80 capillaries): (a) frequency distribution of capillary responses to whisker stimulation, or no stimulation (control; P < 0.001, nonlinear regression with Gaussian fit); (b) violin plot showing distribution of responses of every data point with median (thick red line) and interquartile ranges (thin red lines; *P < 0.05, Mann–Whitney U test); (c) pie charts depict percentage of capillaries with increased (blue), decreased (red), or no change (green) in RBC flux, where a change is classified as an increase or decrease of >10% of baseline.

