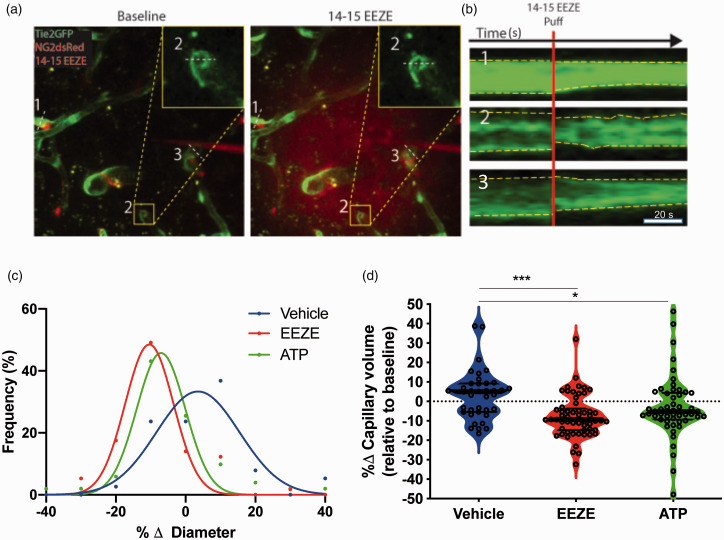
Figure 3.
14,15-EEZE induces capillary constriction: (a) representative z-projections within a time series before (baseline) and after puff of 100 µM 14,15-EEZE in Tie2-GFP/NG2-DsRedmice, which have endothelium fluorescently labeled green and pericytes red. Red “cloud” indicates extent of 14,15-EEZE coverage, which was mixed with 10 kD Texas Red Dextran prior to puff; (b) intensity projections over time (scale bar 20 s) of the three capillary cross sections depicted in (a); (c) frequency distribution of capillary responses for 14,15-EEZE, ATP and vehicle (P < 0.001, nonlinear regression with Gaussian fit); (d) violin plot (median, thick black line and interquartile ranges, thin black lines) of capillary responses to vehicle, 14,15-EEZE and ATP, relative to baseline (*P < 0.05, ***P < 0.001, one-way ANOVA, Dunnett’s multiple comparison test; n = 38 vehicle, n = 571,415-EEZE, n = 51 ATP).

