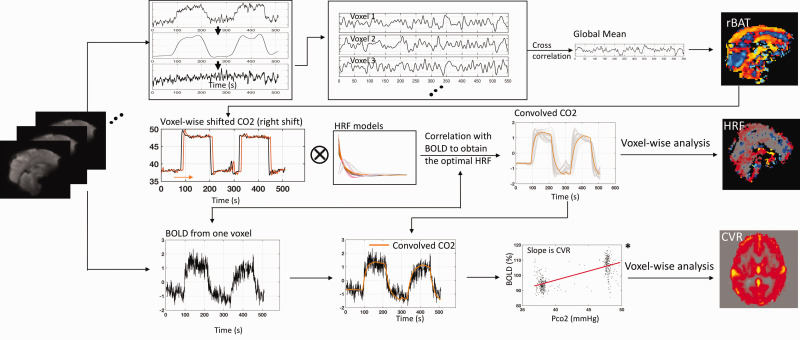
Figure 1.
Methodology for quantitatively characterizing the brain’s reactions to the CO2 challenge. A relative arrival map (rAT) was obtained using systemic low frequency oscillation from BOLD (Top panel). After shifting the PETCO2 waveform (obtained from RespirAct™) based on the rAT map and convolving it with a set of candidate hemodynamic response functions (HRFs: see Figure 2), the voxel-wise optimal HRF was identified by the maximal correlation between observed BOLD signal and the convolved PETCO2 waveform (Middle panel). An improved cerebrovascular reactivity (CVR) map was then obtained by performing a linear fit between the BOLD percentage change and the convolved PETCO2 change (in mmHg), with the slope of this fit line being the CVR value (unit: %/mmHg) (see *; Bottom panel).

