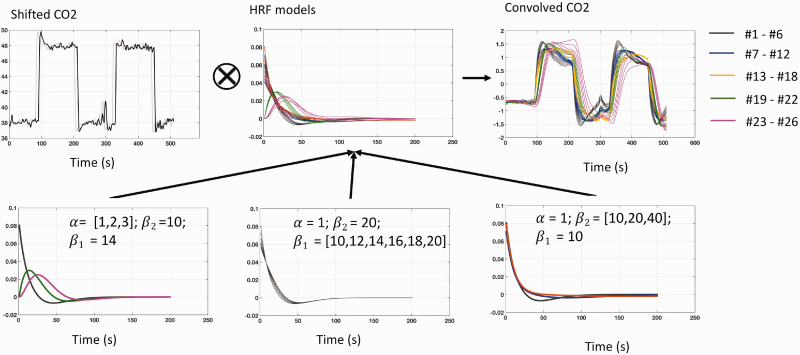
Figure 2.
Generation of the candidate hemodynamic response function (HRF) models. (Top) In the proposed method, the shifted PETCO2 waveform was convolved with different HRFs to identify the best approximation of the observed BOLD signal. (Bottom) Three parameters (, , and ) were varied in the proposed model, producing 26 candidate HRFs. The response delay (time to peak) is predominantly charged by (bottom left); The shape variant of the HRF is predominantly charged by (the maximum; bottom middle) and (the undershoot; bottom right).

