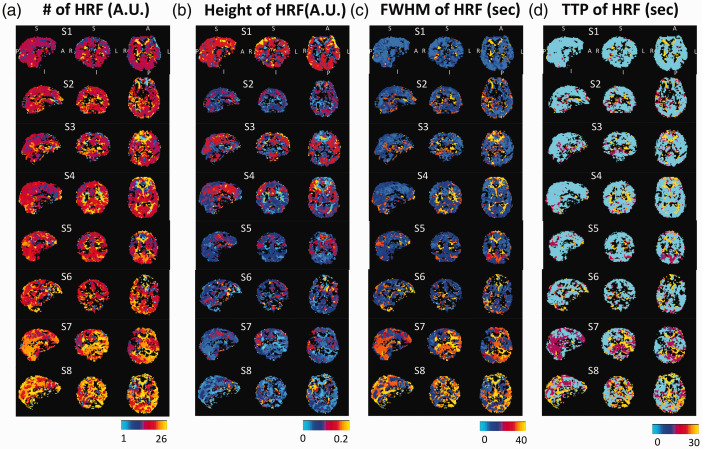
Figure 4.
Optimized hemodynamic response function (HRF) maps (a) and the maps of characteristic metrics in height (b), FWHM (c), and TTP (d) for eight subjects. Those black voxels are those voxels do not pass the thresholding in the AT maps (MCCC < 0.3). To note that all subjects were displayed at the same coordinate with the same order.

