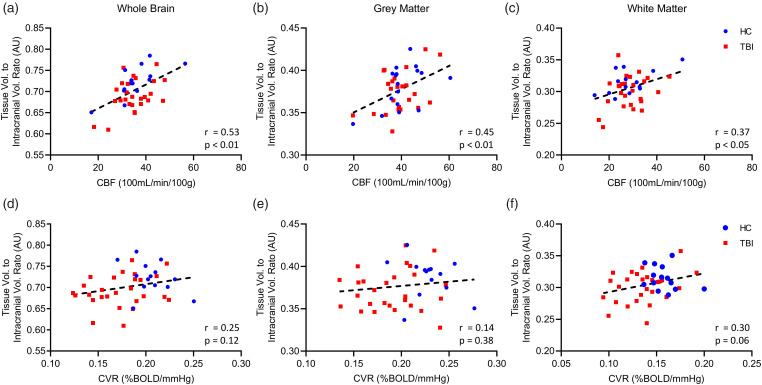
Figure 2.
Correlation of CBF and CVR with whole brain, grey, and white matter volume in TBI and HC subjects. CVR does not correlate with brain volume. Plots of pooled TBI and HC subject whole brain, grey matter, and white matter volume against respective CVR (a–c), and CBF (d–f) showing standard linear regression curve (dotted line) and Pearson correlation statistical values (lower right corner). There was no correlation between whole brain, or grey matter volume when compared to the respective CVR for each tissue type (a–c), however, there is a trend towards significance for correlation between white matter volume and white matter CVR (c). TBI and HC individual group analysis showed correlation between HC whole brain, grey matter, or white matter volume and CVR (a, b, c, Pearson, P > 0.05), and no correlation between TBI whole brain, and grey matter volume and CVR (a, b, Pearson, P > 0.05). There was a weak trend towards correlation between TBI white matter volume and CVR, however, this was not statistically significant (c, Pearson, P = 0.09). Combined values for TBI and HC whole brain, grey matter, and white matter showed strong correlation with respective CBF readings (d–f). Analysis of TBI and HC groups separately demonstrated a positive correlation between whole brain volume and CBF values for both TBI and HC subjects (d). There was a statistically significant positive correlation between CBF and grey matter volume in HC participants, and a trend toward correlation between TBI patient grey matter volume and CBF readings, however, this was not statistically significant (e, Pearson, P = 0.053). HC group white matter volume was strongly correlated with CBF values (f), and TBI patient white matter volume demonstrated a trend toward positive correlation with its respective CBF readings, however, this did not reach statistical significance (P = 0.12). HC, n = 14; TBI, n = 27.

