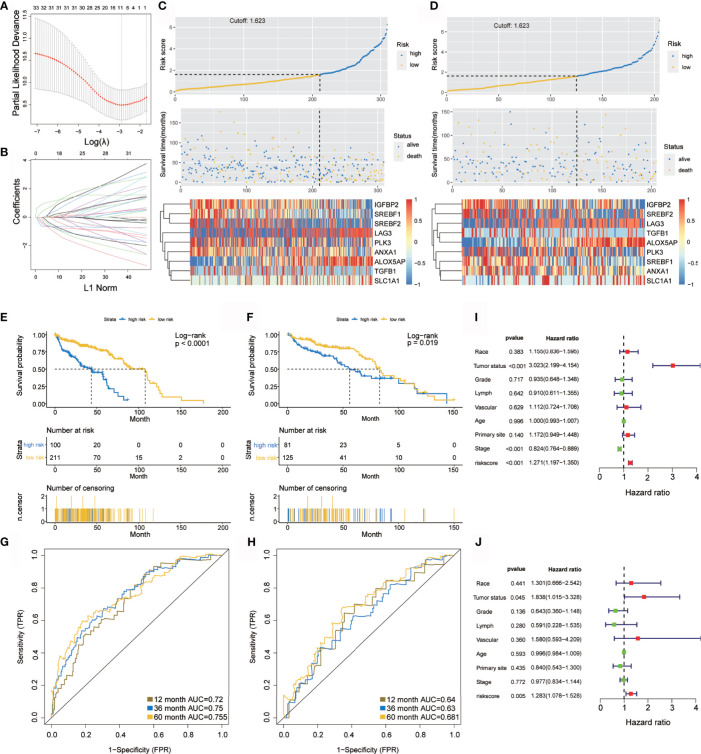
Figure 2.
Construction and verification of the hypoxia prognostic classifier. (A, B) Determination of the number of factors using LASSO analysis. (C, D) Risk score distribution, survival overview, and heatmap in patients in the TCGA training cohort (C) and the TCGA internal validation cohort (D) datasets assigned to high- and low-risk groups based on the risk score. (E, F) Kaplan-Meier curve for the TCGA training cohort (E) and the TCGA internal validation cohort (F). (G, H) ROC curve of the TCGA training cohort (G) and the TCGA internal validation cohort (H). (I, J) Univariate (I) and multivariate (J) Cox regression analysis of risk score, age, tumor status(with tumor or tumor free), grade, lymphovascular invasion, vascular invasion, primary site and stage. ROC, receiver operator characteristic. AUC, the area under the curve.

