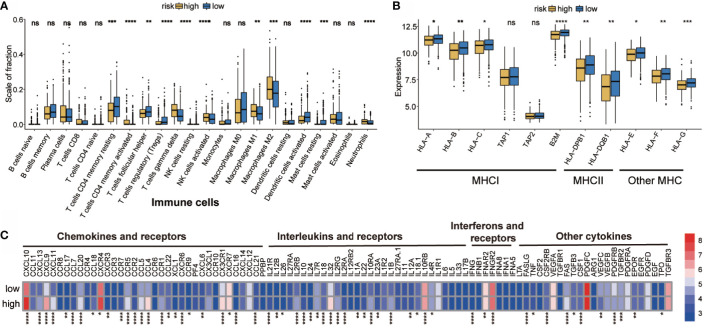
Figure 4.
Potential intrinsic immune escape mechanisms of ovarian cancer. (A) Abundance of each TME infiltrating cell in high- and low-risk groups. (B) Expression of MHC in high- and low-risk groups. (C) Differential mRNA expression of chemokines, ILs, IFNs, and other important cytokines and their receptors in high- and low-risk groups (categorized by the median value). The upper and lower ends of the boxes represent the interquartile range of values. The lines in the boxes represent the median value, and the black dots show the outliers. *p < 0.05, **p < 0.01, ***p < 0.001, ns, p < 0.05, ****P < 0.0001.

