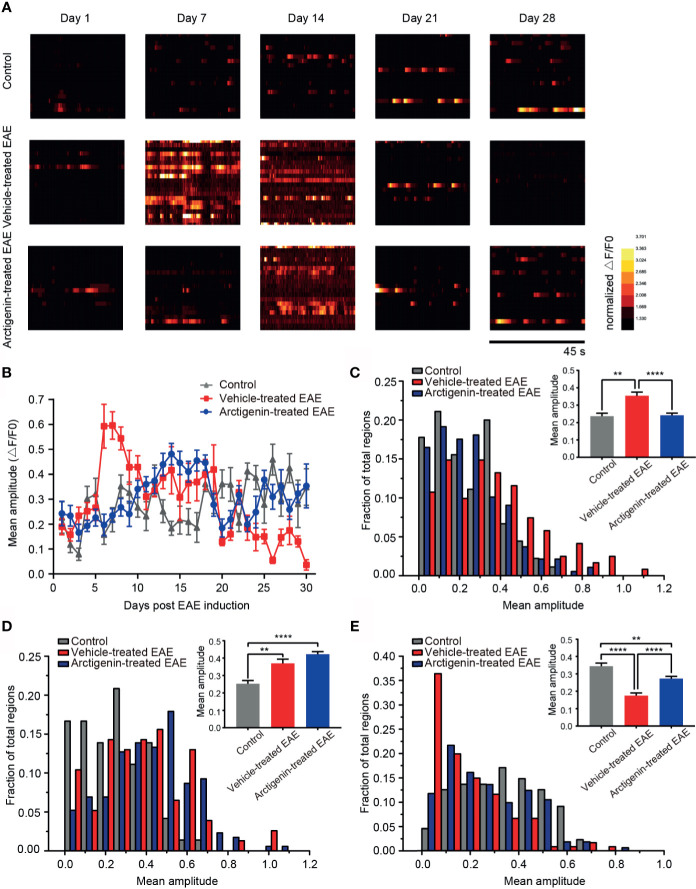
Figure 5.
Arctigenin modulated the change of calcium transient amplitude induced by EAE. (A) Heat maps depicting changes in the calcium transient amplitude (ΔF/F0) for a representative neuronal population at different time point in control mice, vehicle-treated EAE mice and arctigenin-treated EAE mice. Each row represents a single cell. The amplitude of each cell is normalized to the minimum value of its own calcium transient. (B) Mean calcium transient amplitude of imaged regions daily after EAE induction. (C–E) Cumulative distribution histogram and statistical histogram (inset) of calcium transient amplitudes for integration of three stages respectively, including preclinical stage (C, n=99 images in three control mice, n=129 images in four vehicle-treated EAE mice, n=160 images in five arctigenin-treated EAE mice), relapse stage (D, n=72 images in three control mice, n=77 images in four vehicle-treated EAE mice, n=206 images in five arctigenin-treated EAE mice) and remission stage (E, n=99 images in three control mice, n=126 images in four vehicle-treated EAE mice, n=245 images in five arctigenin-treated EAE mice), **p < 0.01, ****p < 0.0001, one-way ANOVA with Kruskal-Wallis test.

