
Figure 2.
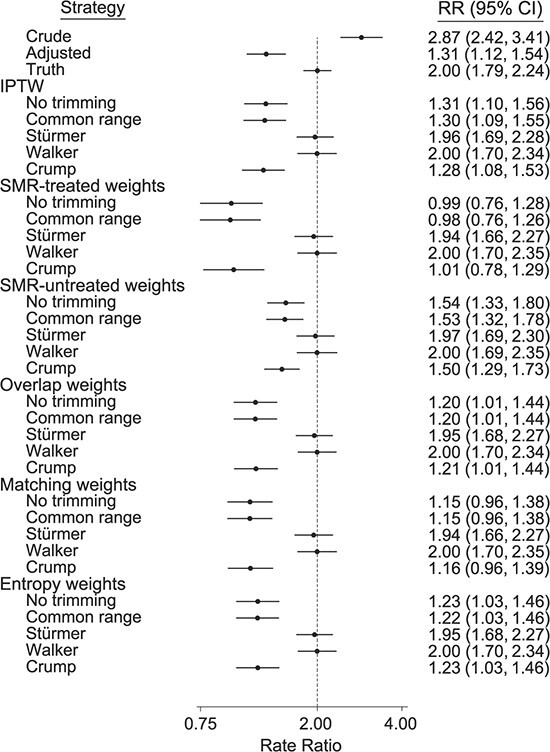
Mean rate ratios (RRs) from 5,000 simulated studies with unmeasured confounding due to treatment withheld, mimicking frailty. RRs are exponentiated mean log (RR) across simulations, and 95% confidence intervals (CIs) are derived from the empirical variance of the log(RR) across simulations. True RR = 2.0; treatment prevalence = 20%; area under the receiver operating characteristic curve (c statistic) = 0.75. Bars, empirical 95% CIs. IPTW, inverse probability of treatment weighting; SMR, standardized mortality ratio.