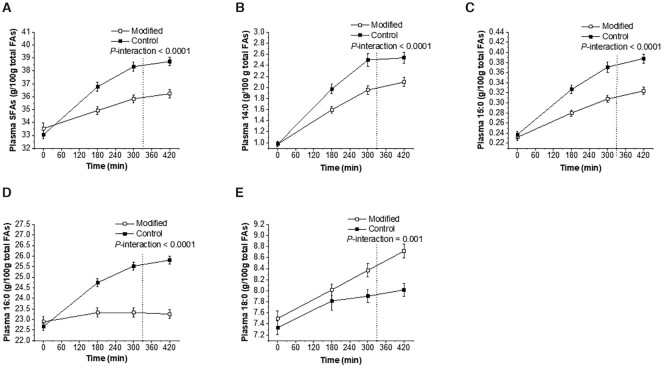
FIGURE 2.
Time-course profiles of postprandial plasma total lipid FAs in response to sequential high-fat mixed-meal challenges (breakfast at 0 min and lunch at 330 min) rich in FA-modified or conventional dairy products (control) in adults at moderate cardiovascular risk for total SFAs (A), 14:0 (B), 15:0 (C), 16:0 (D), and 18:0 (E). Values are untransformed and unadjusted means ± SEMs, n = 47–48. The dotted lines represent the timing of the second meal (330 min). Linear mixed-model analysis was used to explore the effects of treatment and time, with an adjustment made in all cases for fixed effects of period, time, treatment, gender, age, and BMI. Participant was included as a random effect. P ≤ 0.01 was deemed significant to acknowledge multiplicity. FA, fatty acid.

