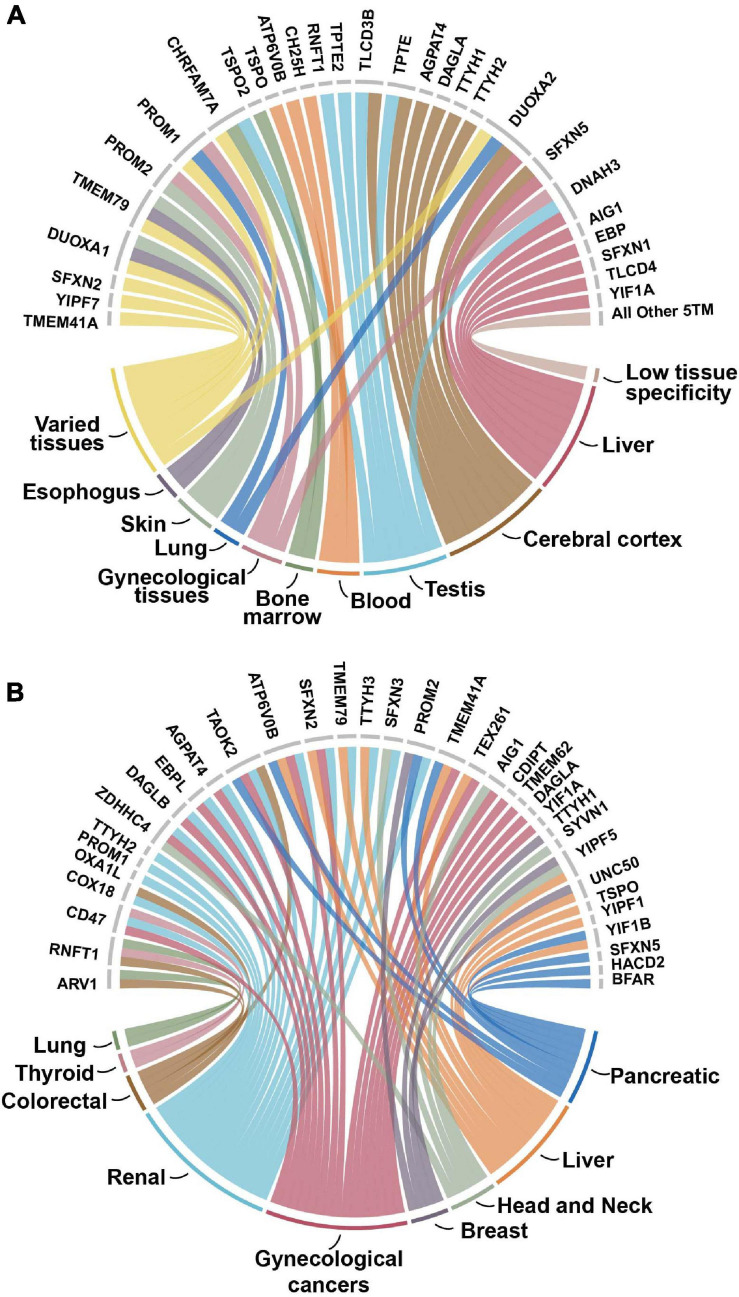
FIGURE 4.
(A) Enhanced tissue expression of 5TM dataset. The enhanced or enriched expression of proteins in the 5TM dataset with the different types of tissues on the bottom part of the figure and associated proteins on the top part. Data are from The Tissue Atlas (Amorim et al., 2017). More than 35% of the proteins have enhanced or enriched expression in the cerebral cortex, liver, testis and blood tissues. The category Varied tissues includes intestine, breast, thyroid, parathyroid, gall bladder, prostate, and pancreas tissues. The category All Other 5TM includes thirty proteins in the dataset that have low tissue specificity. (B) 5TM proteins as prognostic markers for cancer. The nine different tumor types are on the bottom part of the figure while the 35 prognostic proteins associated with them are on the top half. Approximately 60% of the genes in the dataset are identified in the Pathology Atlas as candidate prognostic genes that are associated with the clinical outcome of different tumor types. The genes are identified from correlation analyses of gene expression and clinical outcome where Kaplan-Meier plots with high significance (p < 0.001) were considered prognostic (Pujar et al., 2018). Of the 35 proteins identified, 21 are associated with several different types of cancers. Gynecologic cancer includes cervical, endometrial, ovarian, and urothelial cancers. Proteins not identified as prognostic are not included in the figure.

