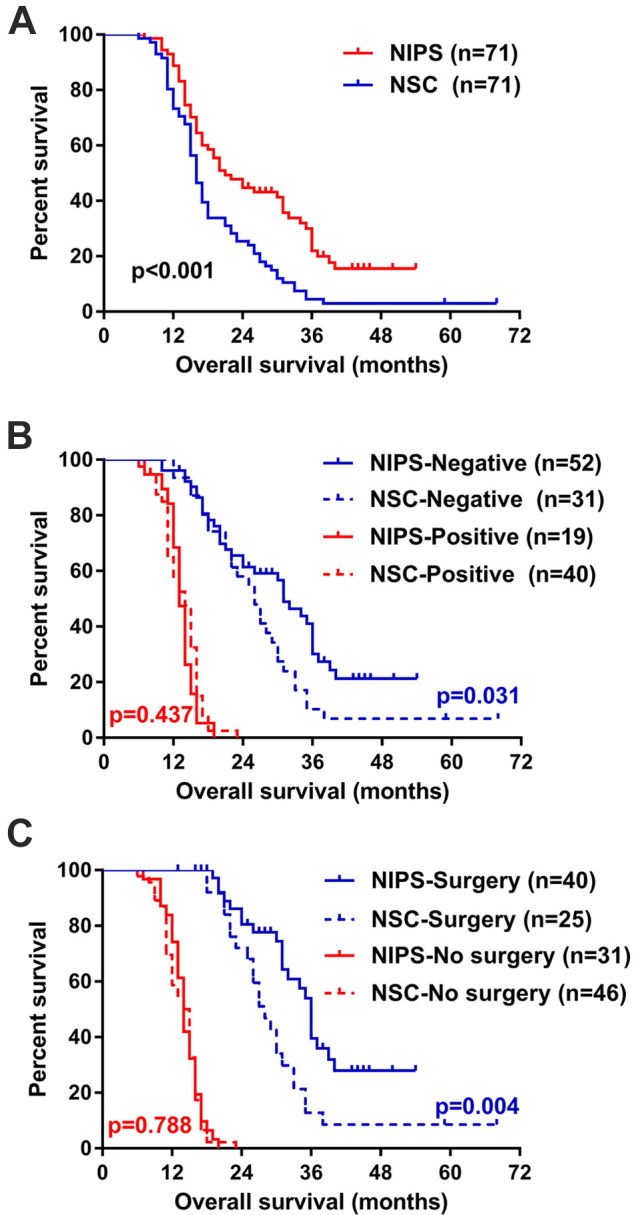
Figure 1.

Kaplan-Meier overall survival analysis. A, NIPS group (n = 71) versus NSC group (n = 71) after PSM. B, Stratified by cytology. C, Stratified by conversion surgery. NIPS indicates neoadjuvant intraperitoneal and systemic chemotherapy; NSC, neoadjuvant systemic chemotherapy.
