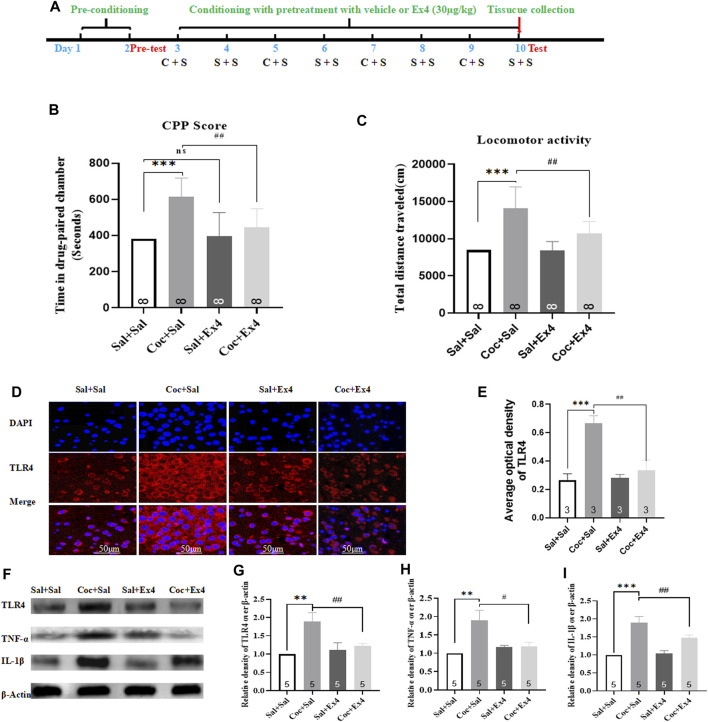
FIGURE 5.
Ex4’s pretreatment inhibits the acquisition of cocaine-induced CPP and alleviates expression levels of TLR4, TNF-α and IL-1β. (A) The experimental schedule for saline (S) as well as cocaine (C) and exendin-4 treatment. (B) CPP scores following cocaine conditioning with systemic treatment with saline and Ex4 (30.0 μg/kg) show that compared to Sal+Sal group cocaine induced a significant CPP that was lessened by Ex4 treatment. *** represents p < 0.001 vs Sal+Sal, ## represent p < 0.01 vs Coc+Sal, ns represents no significant difference, one-way ANOVA followed by a Bonferroni’s post hoc test. (C) Locomotor activity following cocaine conditioning with systemic pretreatment with saline and Ex4 (30.0 μg/kg) show that a hyperactivity induced by cocaine was reduced by Ex4 treatment. *** represents p < 0.001 vs Sal+Sal , ## represent p < 0.01 vs Coc+Sal, one-way ANOVA followed by a Bonferroni’s post hoc test. (D) Representative images of immunofluorescent staining with TLR4 (red), and DAPI (blue) in the hippocampus from the different groups (scale bar = 50 μm). Systemic administration of Ex4 diminished fluorescence density of TLR4 up-regulated by cocaine exposure (n = 3 in each group). (E) Semiquantitative analysis of the relative density of TLR4 by densitometric analysis in different groups. *** represents p < 0.001 vs Sal+Sal, ## represent p < 0.01 vs Coc+Sal, one-way ANOVA followed by a Tukey’s post hoc test. (F) Representative immunoblots of TLR4, TNF-α and IL-1β proteins in different groups (n = 5 in each group). (G) Semiquantitative analysis of the relative levels of TLR4 by densitometric analysis in different groups. *** represents p < 0.001 vs Sal+Sal , ## represent p < 0.01 vs Coc+Sal, one-way ANOVA followed by a Tukey’s post hoc test. (H) Semiquantitativeanalysis of the relative levels of TNF-α by densitometric analysis in different groups. ** represents p < 0.01 vs Sal+Sal, # represent p < 0.05 vs Coc+Sal, one-way ANOVA followed by a Tukey’s post hoc test. (I) Semiquantitative analysis of the relative levels of IL-1β by densitometric analysis in different groups. *** represents p < 0.001 vs Sal+Sal, ## represent p < 0.01 vs Coc+Sal, one-way ANOVA followed by a Tukey’s posthoc test. All data are presented as the mean ± SEM. Sal indicates saline. Coc indicates cocaine. Ex4 indicates Exendin-4.

