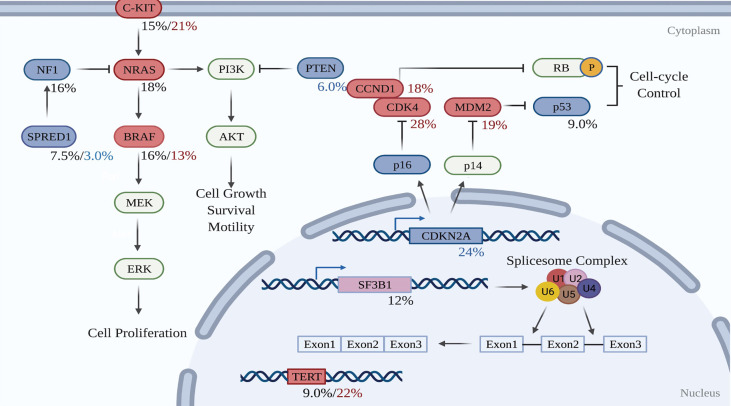
Figure 2.
Molecular pathways involved in the development of mucosal melanoma. Red-filled rectangles indicate genes experiencing activating mutation or amplification, while blue-filled rectangles genes undoing suppressing mutation or deletion. Black figures suggest mutation rates, whereas red and blue percentages are respectively amplification and deletion proportions in the test cohort. Created with BioRender.com (2021). Retrieved from https://app.biorender.com/biorender-templates.

