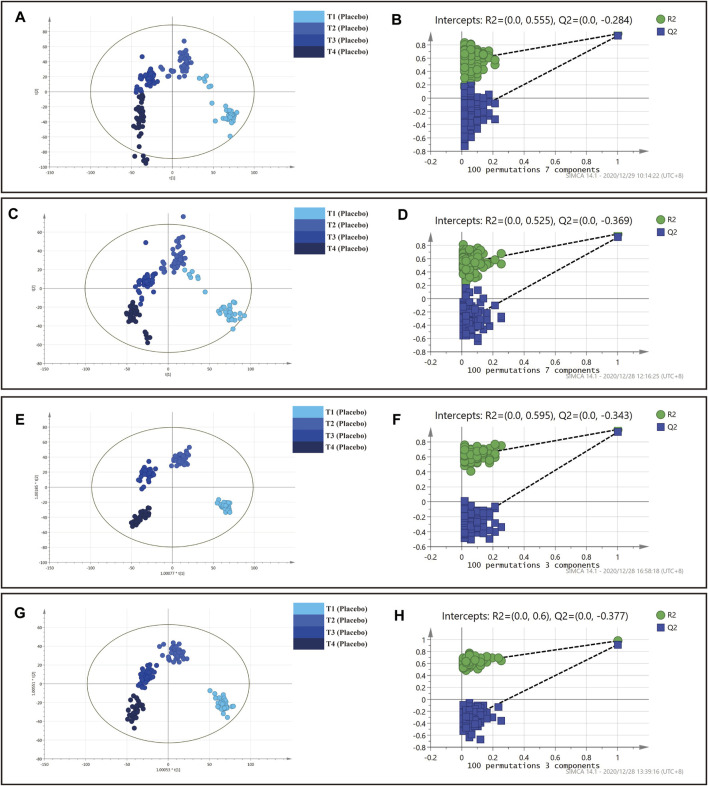
FIGURE 4.
PLS-DA and OPLS-DA analysis on plasma samples in placebo group. (A) PLS-DA analysis in positive mode. (B) Permutation test of PLS-DA analysis in positive mode. (C) PLS-DA analysis in negative mode. (D) Permutation test of PLS-DA analysis in negative mode. (E) OPLS-DA analysis in positive mode. (F) Permutation test of OPLS-DA analysis in positive mode. (G) OPLS-DA analysis in negative mode. (H) Permutation test of OPLS-DA analysis in negative mode.  : T1 (Placebo),
  : T2 (Placebo),
  : T3 (Placebo),
  : T4 (Placebo).

