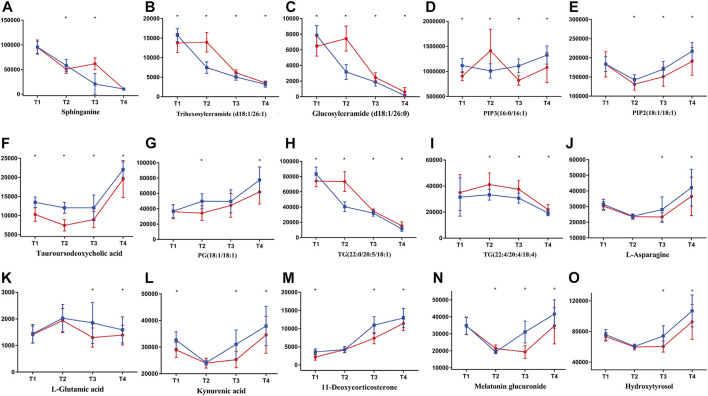
FIGURE 8.
Typical metabolites with significant changes in AH subgroup. Lines in blue ( ) represent ZYP group while in red (
 ) represent placebo group. Contents of metabolites were assessed with t test between ZYP and placebo group. Contents of metabolites are shown in this figure, i.e., (A) sphinganine, (B) trihexosylceramide (d18:1/26:1), (C) glucosylceramide (d18:1/26:0), (D) PIP3(16:0/16:1), (E) PIP2(18:1/18:1), (F) tauroursodeoxycholic acid, (G) PG(18:1/18:1), (H) TG(22:0/20:5/18:1), (I) TG(22:4/20:4/18:4), (J) L-asparagine, (K) L-glutamic acid, (L) kynurenic acid, (M) 11-deoxycorticosterone, (N) melatonin glucuronide, (O) hydroxytyrosol. *p < 0.05 were regarded as statistically significant, compared with placebo group.

