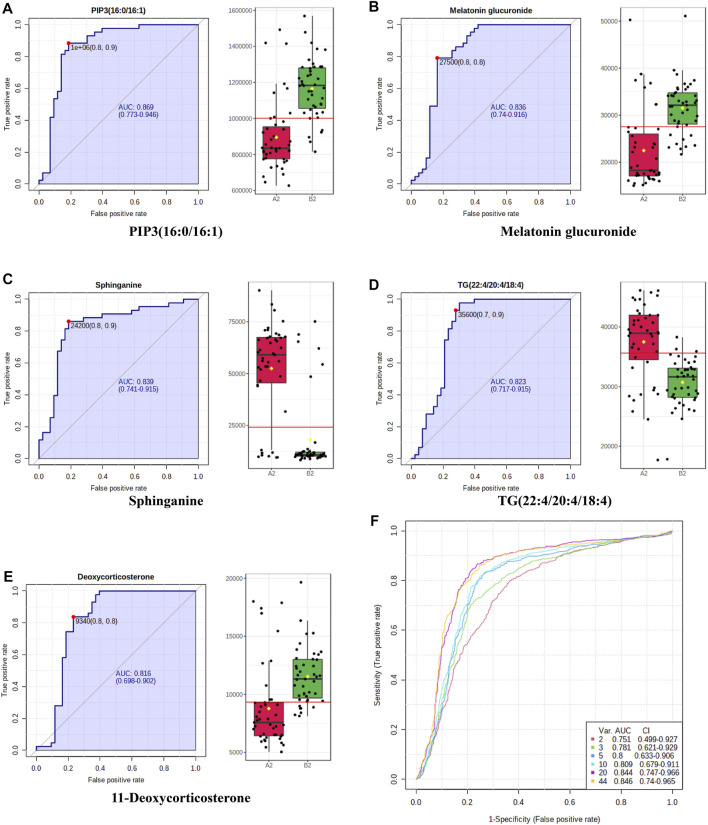
FIGURE 9.
Representative ROC curve plots of potential biomarkers. (A–E) Representative ROC curves and AUC values of potential biomarkers with high-performance prediction. Box plots in green ( ) represent ZYP group while in red (
 ) represent placebo group. (F) Multivariate exploratory ROC analysis overview.

