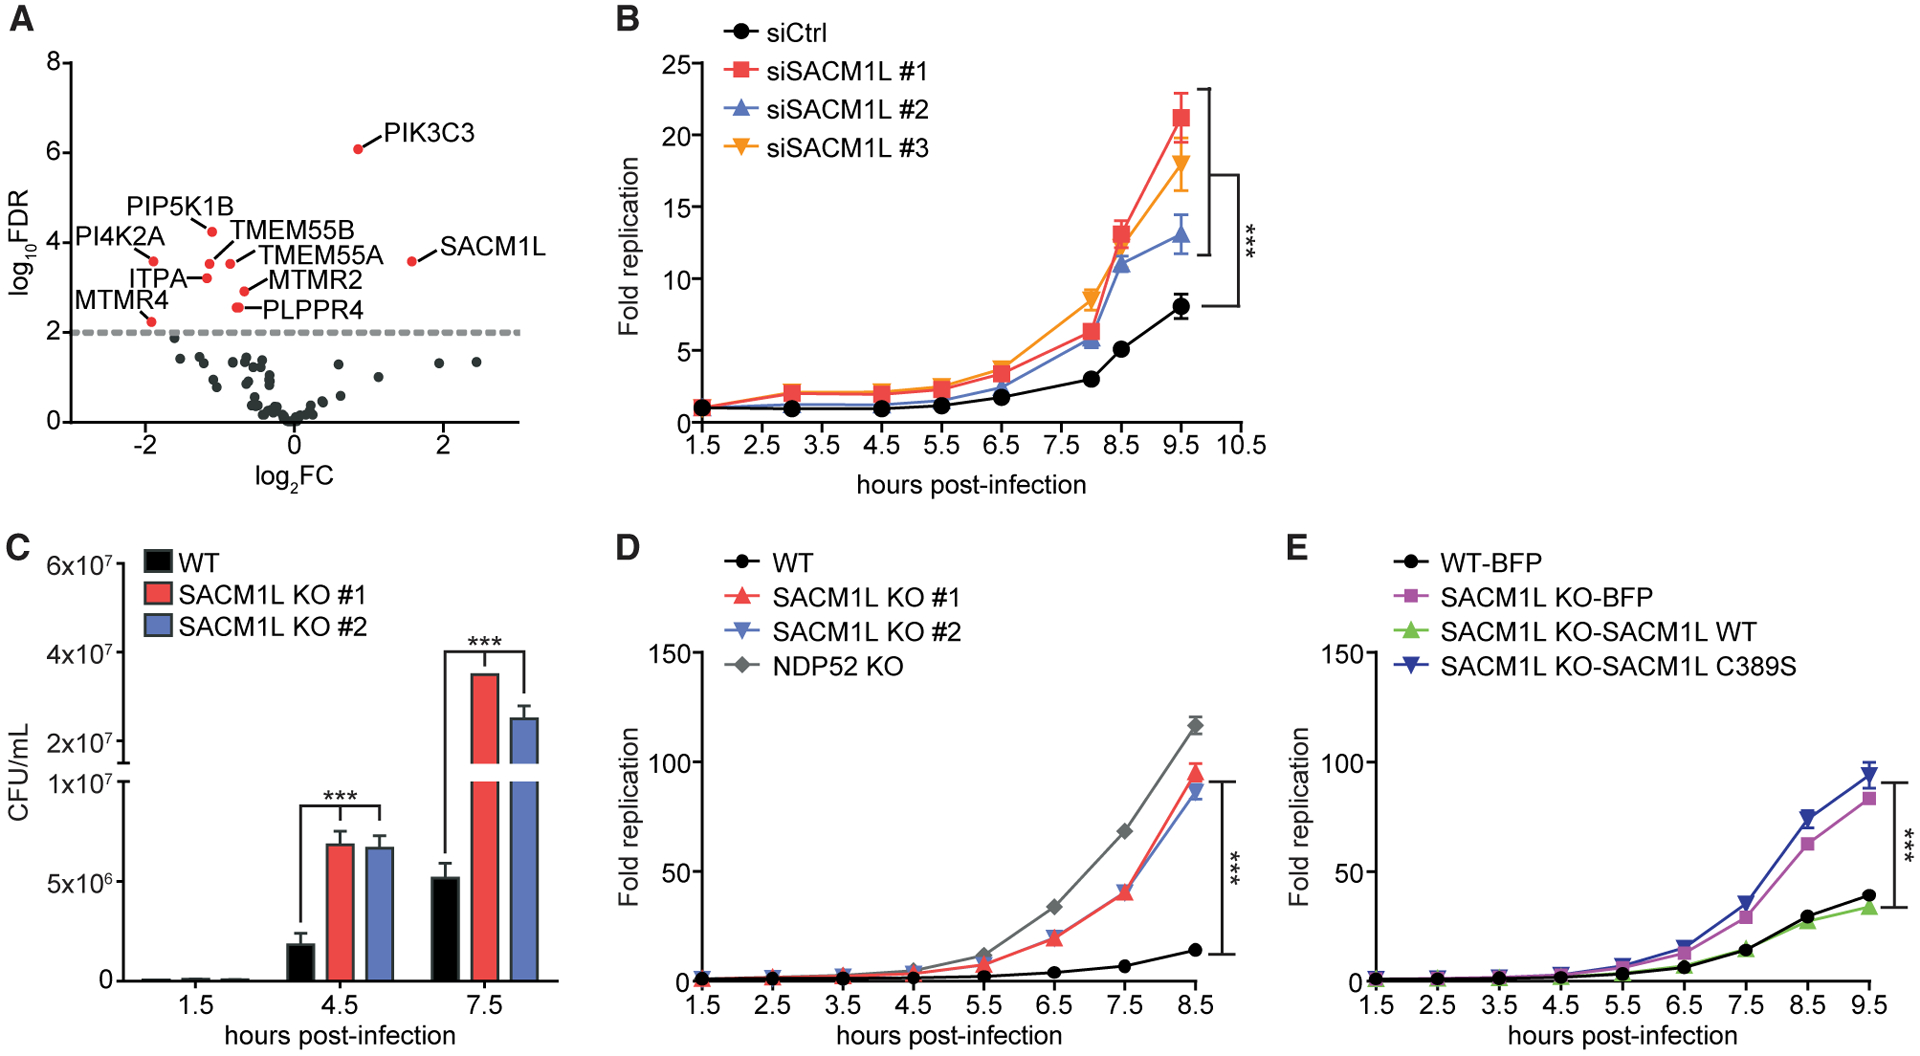
Figure 1. SAC1 restricts intracellular bacterial replication.

(A) Volcano plot of siRNA screen shows log2 fold change (log2FC) of Salmonella replication compared with that of control siRNA. Data represent combined analysis from three independent experiments. Red dots indicate genes with false discovery rate (FDR) values of <0.01.
(B) HeLa cells transfected with control (Ctrl) or one of three independent SACM1L-directed siRNA molecules were infected with Salmonella expressing bacterial luciferase. Luciferase levels were measured over time. Bacterial replication was normalized to baseline infection at 1.5 h post-infection.
(C) CFU/mL of Salmonella at indicated times after infection of WT or SACM1L KO cells.
(D) Fold change of luciferase-expressing Salmonella replication in WT, SACM1L KO, and NDP52 KO cells
(E) WT cells stably expressing BFP and SACM1L KO cells stably expressing BFP, SACM1L WT, or SACM1L C389S were infected with luciferase-expressing Salmonella. Luciferase levels were measured over time. Bacterial replication was normalized to baseline infection at 1.5 h post-infection. For all quantifications, three independent experiments were analyzed using ANOVA (mean ± SEM [standard error of the mean]). ***p < 0.001.
