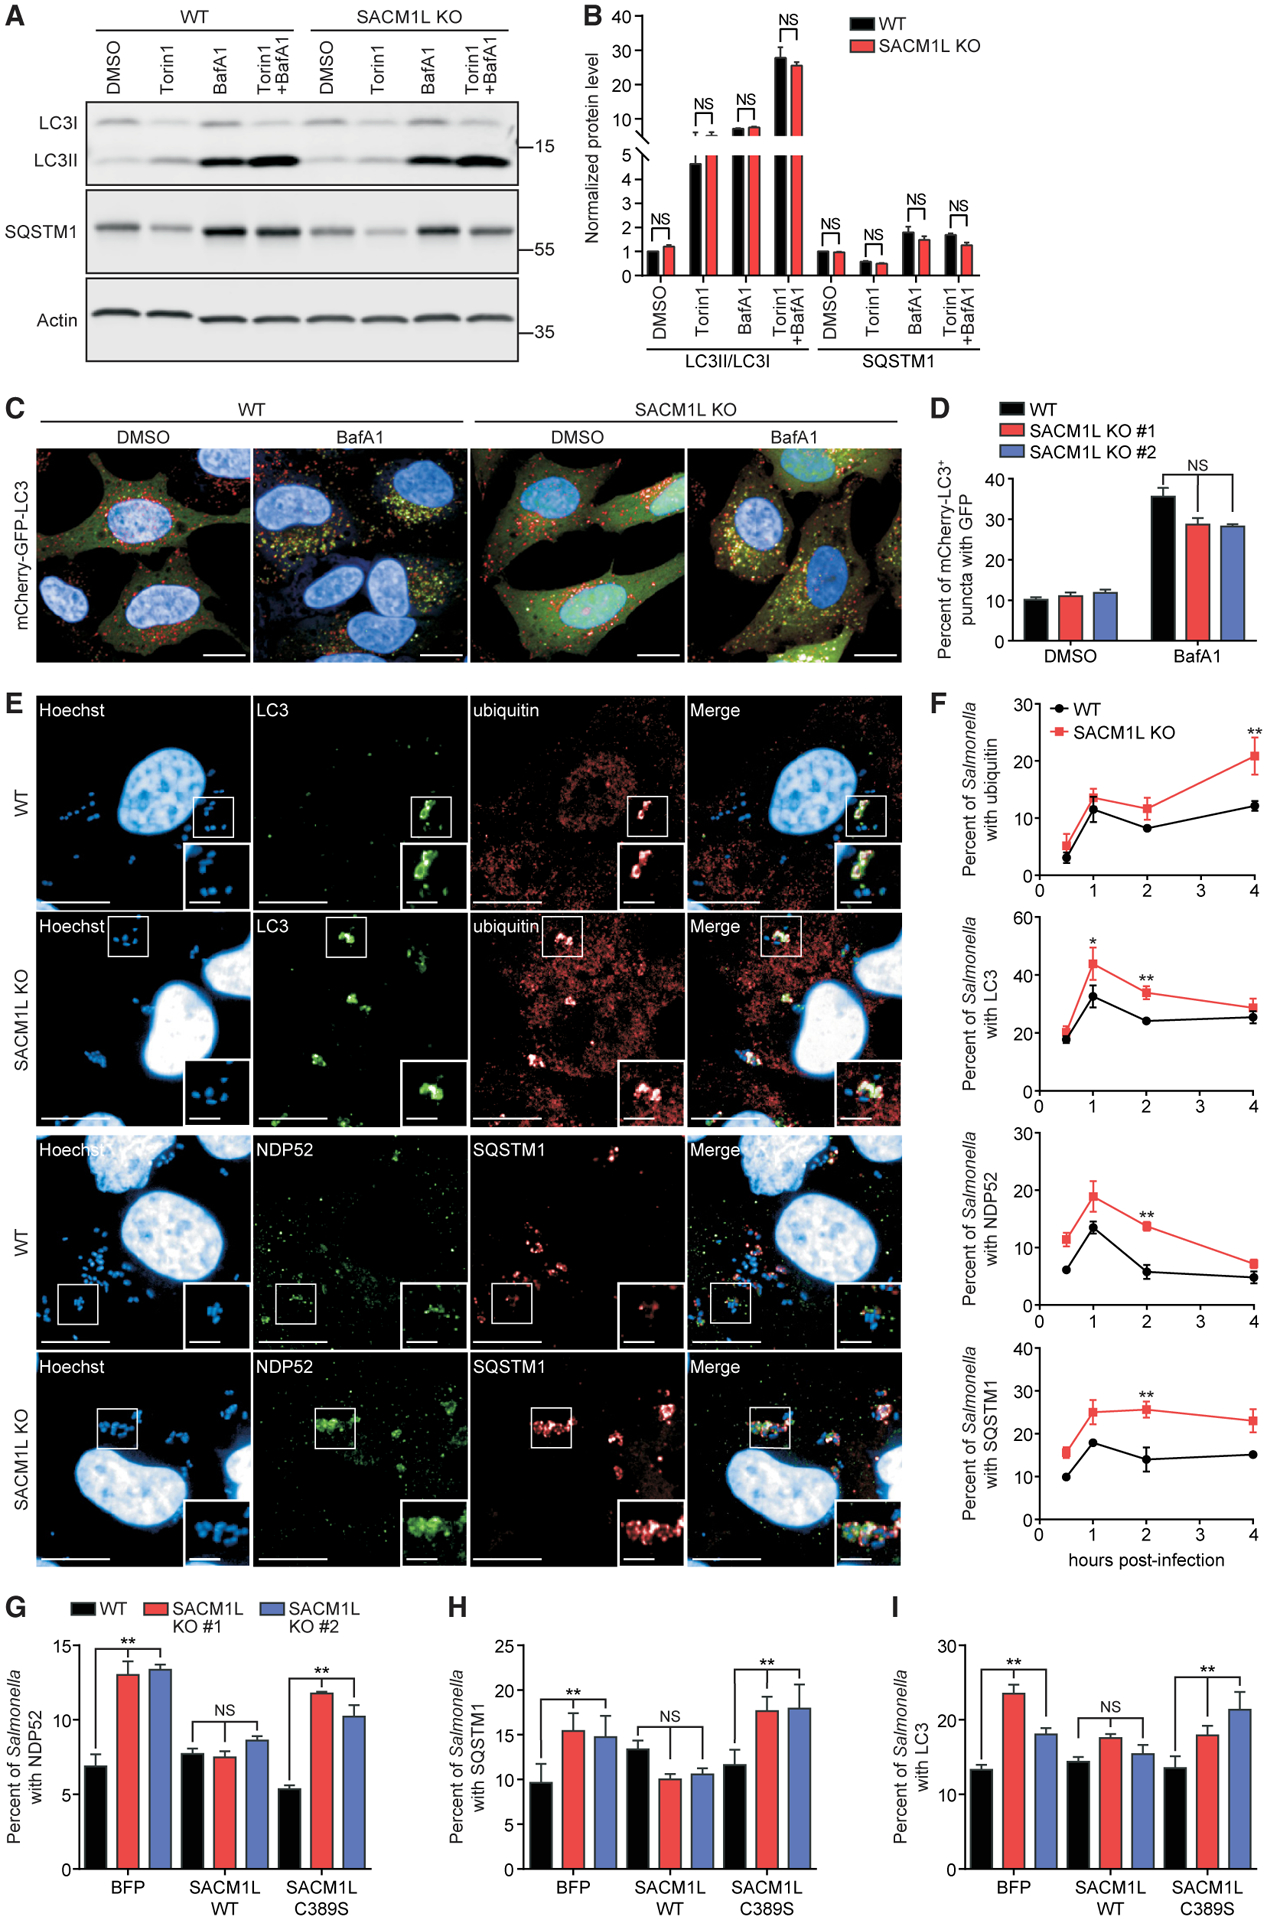
Figure 2. SAC1 activity regulates maturation of Salmonella-containing autophagosomes.

(A and B) Representative immunoblot (A) and quantification (B) of LC3 conversion and SQSTM1 in WT and SACM1L KO cells treated with 0.1% DMSO, 1 μM Torin1, 200 ng/ml BafA1, or a combination of Torin1 and BafA1 for 4 h. Quantification of LC3II/LC3I ratio or SQSTM1 protein was normalized to DMSO-treated WT cells.
(C and D) Representative confocal images (C) and quantification (D) of mCherry-GFP-LC3 expression in WT and SACM1L KO cells treated with DMSO or BafA1 for 4 h. Scale bars represent 20 μm.
(E and F) Representative confocal images (E) and quantifications (F) of Salmonella associated with endogenous ubiquitin, LC3, NDP52, and SQSTM1 in WT and SACM1L KO cells at indicated times post-infection. Images were captured at 2 h post-infection. Insets are boxed regions magnified (1.8×). Hoechst shows HeLa cell nuclei and Salmonella. Scale bars represent 20 μm in full images and 5 μm in insets.
(G–I) Percentage of Salmonella associated with endogenous NDP52 (G), SQSTM1 (H), or LC3 (I) in WT and SACM1L KO cells stably expressing BFP, SACM1L WT, or SACM1L C389S at 2 h post-infection. For all quantifications, over 500 cells were analyzed. Three independent experiments were analyzed using ANOVA (mean ± SEM). *p < 0.05, **p < 0.01; NS, not significant.
See also Figure S2.
