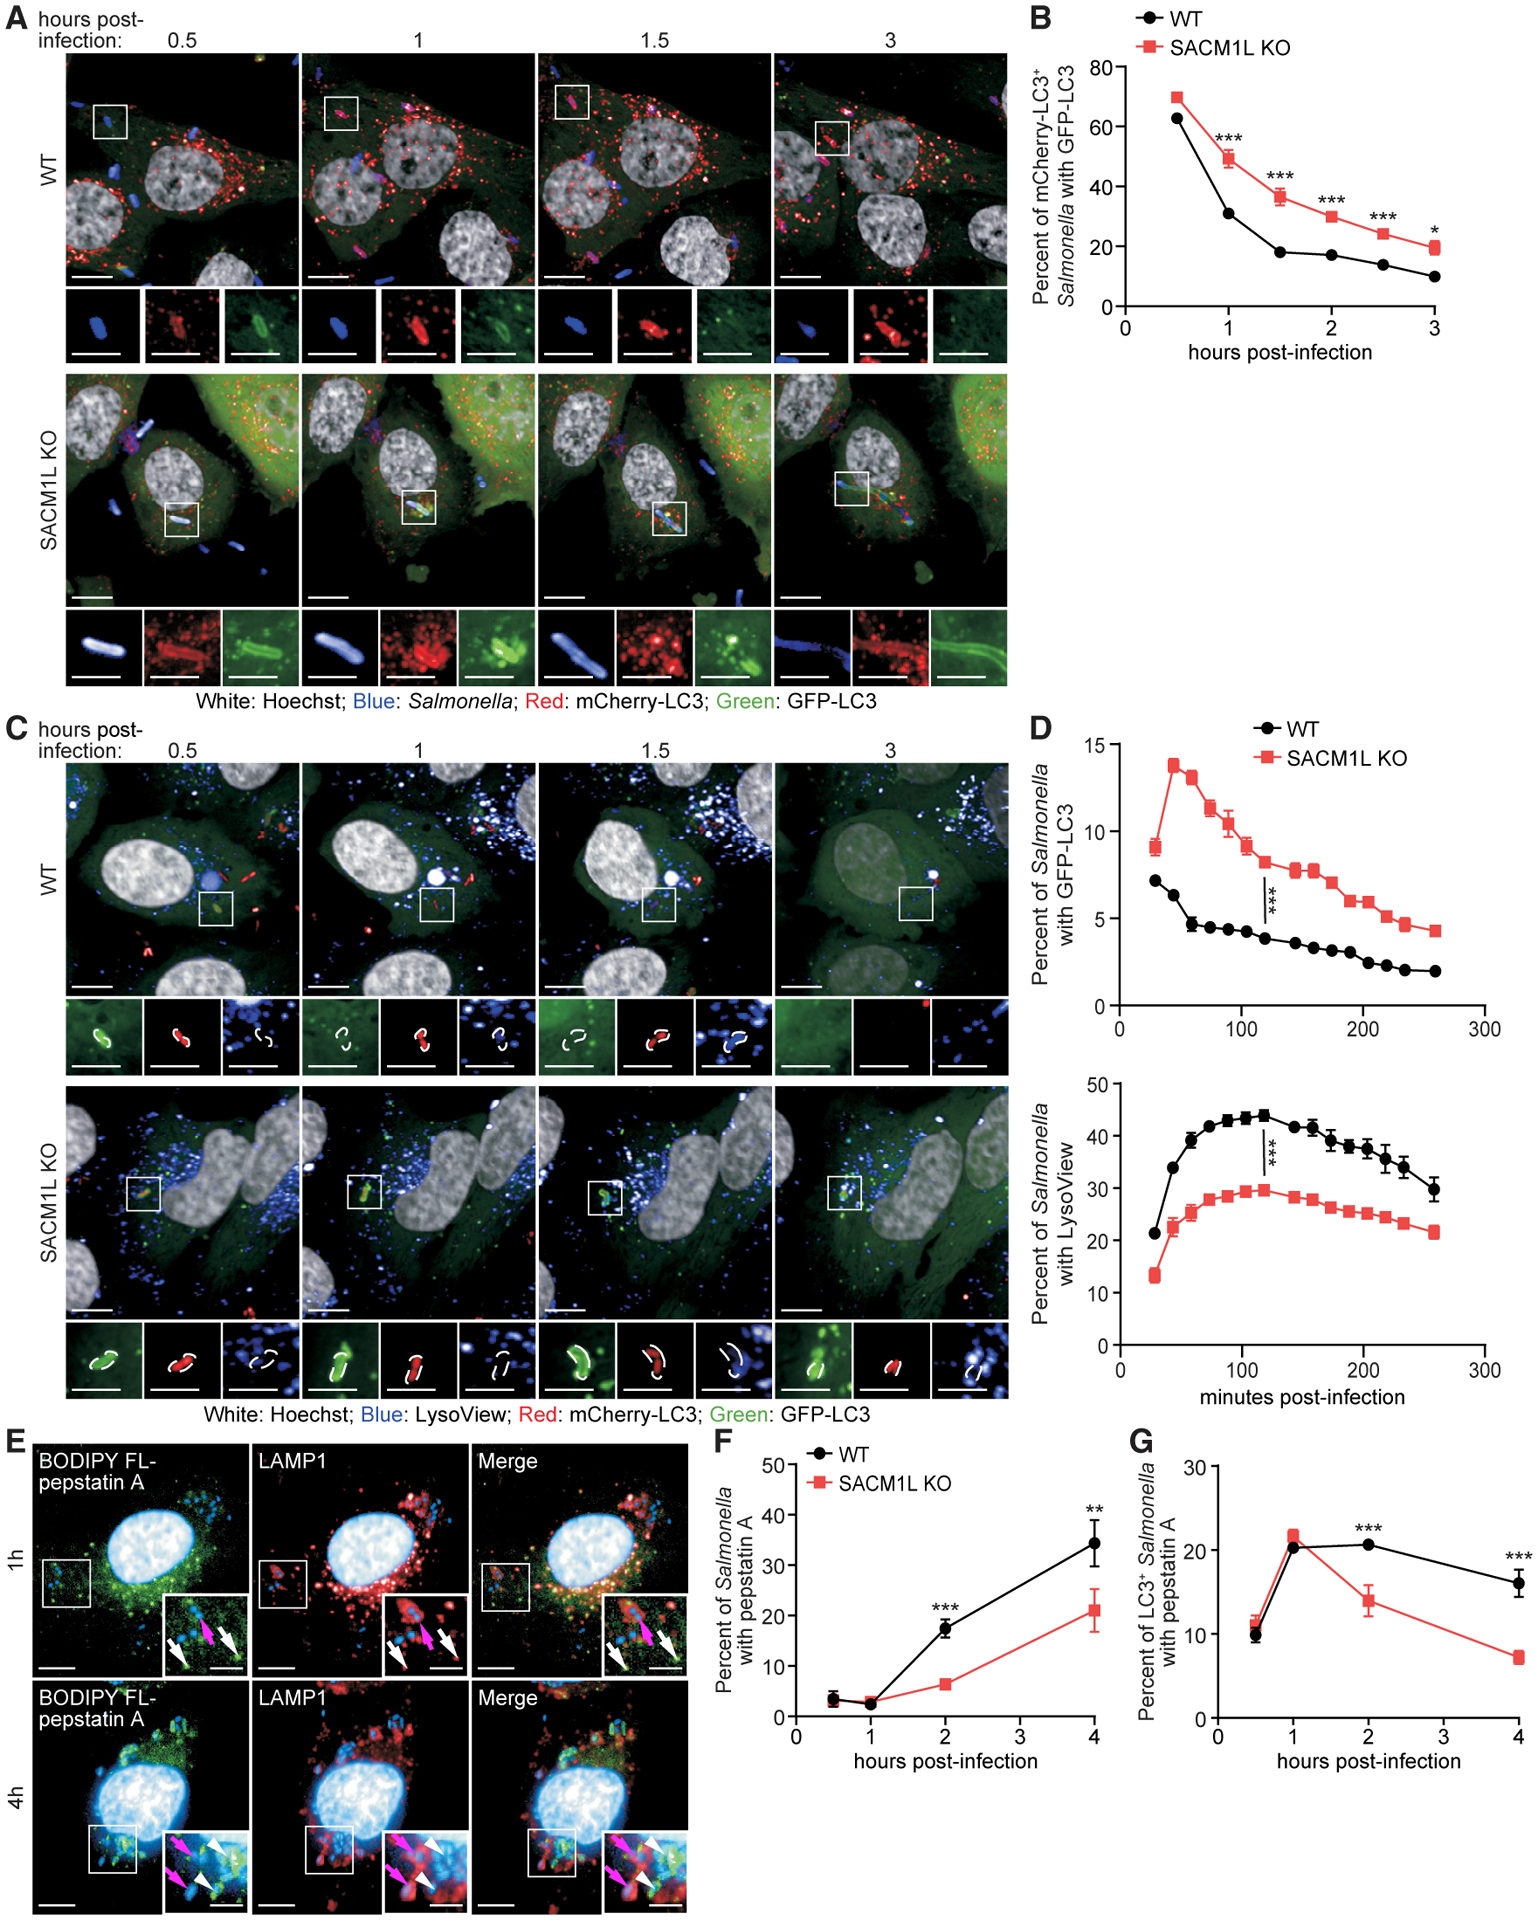
Figure 3. SAC1 loss impairs lysosomal fusion.

(A and B) WT and SACM1L KO cells stably expressing mCherry-GFP-LC3 were stained with Hoechst, infected with Salmonella labeled with CellTracker deep red dye, washed, imaged by live confocal microscopy (A), and quantified (B). Percentage of GFP-LC3+ Salmonella-containing autophagosomes is shown at indicated times post-infection.
(C and D) WT and SACM1L KO cells stably expressing GFP-LC3 were infected with dsRed-expressing Salmonella and stained with LysoView 633 dye and Hoechst. Live confocal microscopy images (C) and percentage (D) of Salmonella positive for GFP-LC3 (top) or LysoView dye (bottom) are shown. Magnified images (2.4×) show separated channels of the boxed region in merged images. Scale bars represent 10 μm in merged images and 5 μm in magnified images.
(E) Co-immunostaining of BODIPY FL-pepstatin A, LAMP1, and Hoechst in WT cells at 1 h and 4 h post-infection. Insets are boxed regions magnified (1.8×). Scale bars represent 10 μm in full images and 5 μm in insets. Magenta arrows indicate LAMP1+pepstatin A− Salmonella. White arrows (1-h image insets) indicate pepstatin A+ lysosomes. White arrowheads (4-h image insets) indicate pepstatin A+ Salmonella.
(F and G) Percentage of Salmonella (F) or LC3+ Salmonella (G) associated with pepstatin A in WT and SACM1L KO cells at indicated times post-infection. For all quantifications, over 500 cells were analyzed for each condition. Three independent experiments were analyzed using ANOVA (mean ± SEM). *p < 0.05, **p < 0.01, ***p < 0.001.
See also Figure S3.
