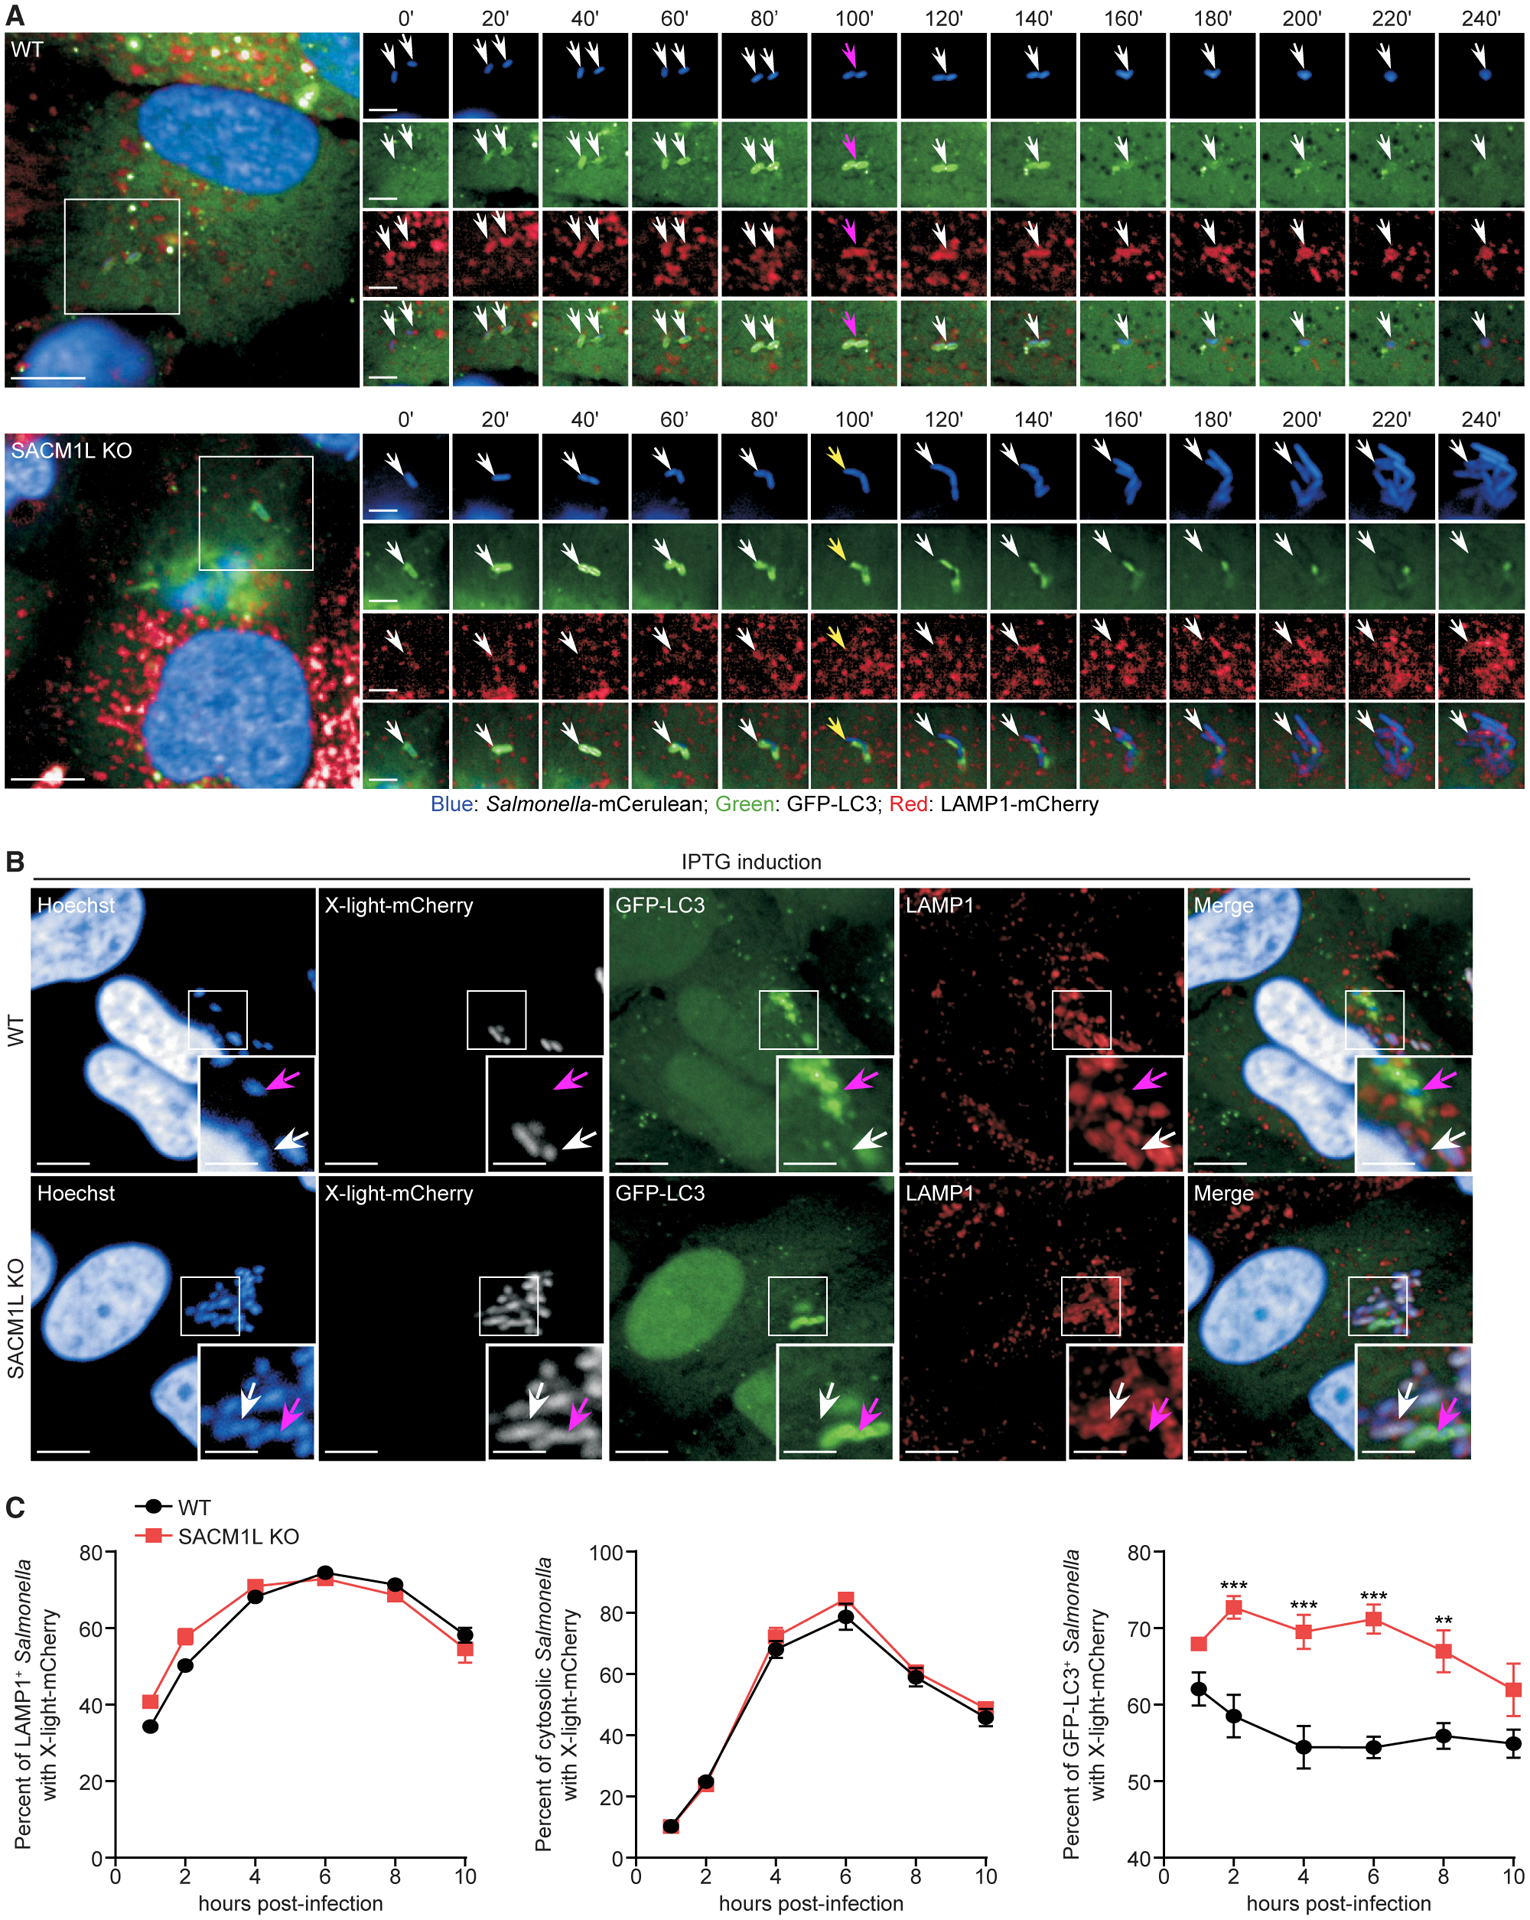
Figure 4. SAC1 loss impairs the ability of autophagosomes to restrict Salmonella replication.

(A) WT and SACM1L KO cells stably transduced with GFP-LC3 and LAMP1-mCherry were stained with Hoechst for 10 min, infected with mCerulean-expressing Salmonella for 15 min, washed, and imaged by live confocal microscopy every 20 min for 6 h. Timescale 0’ to 240’ is the minutes from detection of the bacteria in the cell and focal plane. White arrows indicate Salmonella. Magenta arrows (top) indicate peak GFP-LC3 intensity. Yellow arrows (bottom) show Salmonella escaping from autophagosomes prior to replicating in the host cytoplasm. Image series are boxed regions magnified (1.8×). Scale bars represent 10 μm in image series and 5 μm in full images.
(B) Representative confocal images of IPTG-induced mCherry expression in Salmonella within LAMP1+ (SCV) or GFP-LC3+ (autophagosome) compartments in WT and SACM1L KO cells at 6 h post-infection. Magenta arrows indicate GFP-LC3+ Salmonella. White arrows indicate LAMP1+ Salmonella. Insets are boxed regions magnified (2×). Scale bars represent 10 μm in full images and 5 μm in insets.
(C) Percentage of induced mCherry signal in LAMP1+, GFP-LC3−LAMP1−, (cytosolic), or GFP-LC3+ Salmonella in WT and SACM1L KO cells. For quantification, over 3,000 bacteria were analyzed. Two independent experiments were analyzed using ANOVA (mean ± SEM). **p < 0.01, ***p < 0.001.
See also Figure S4.
