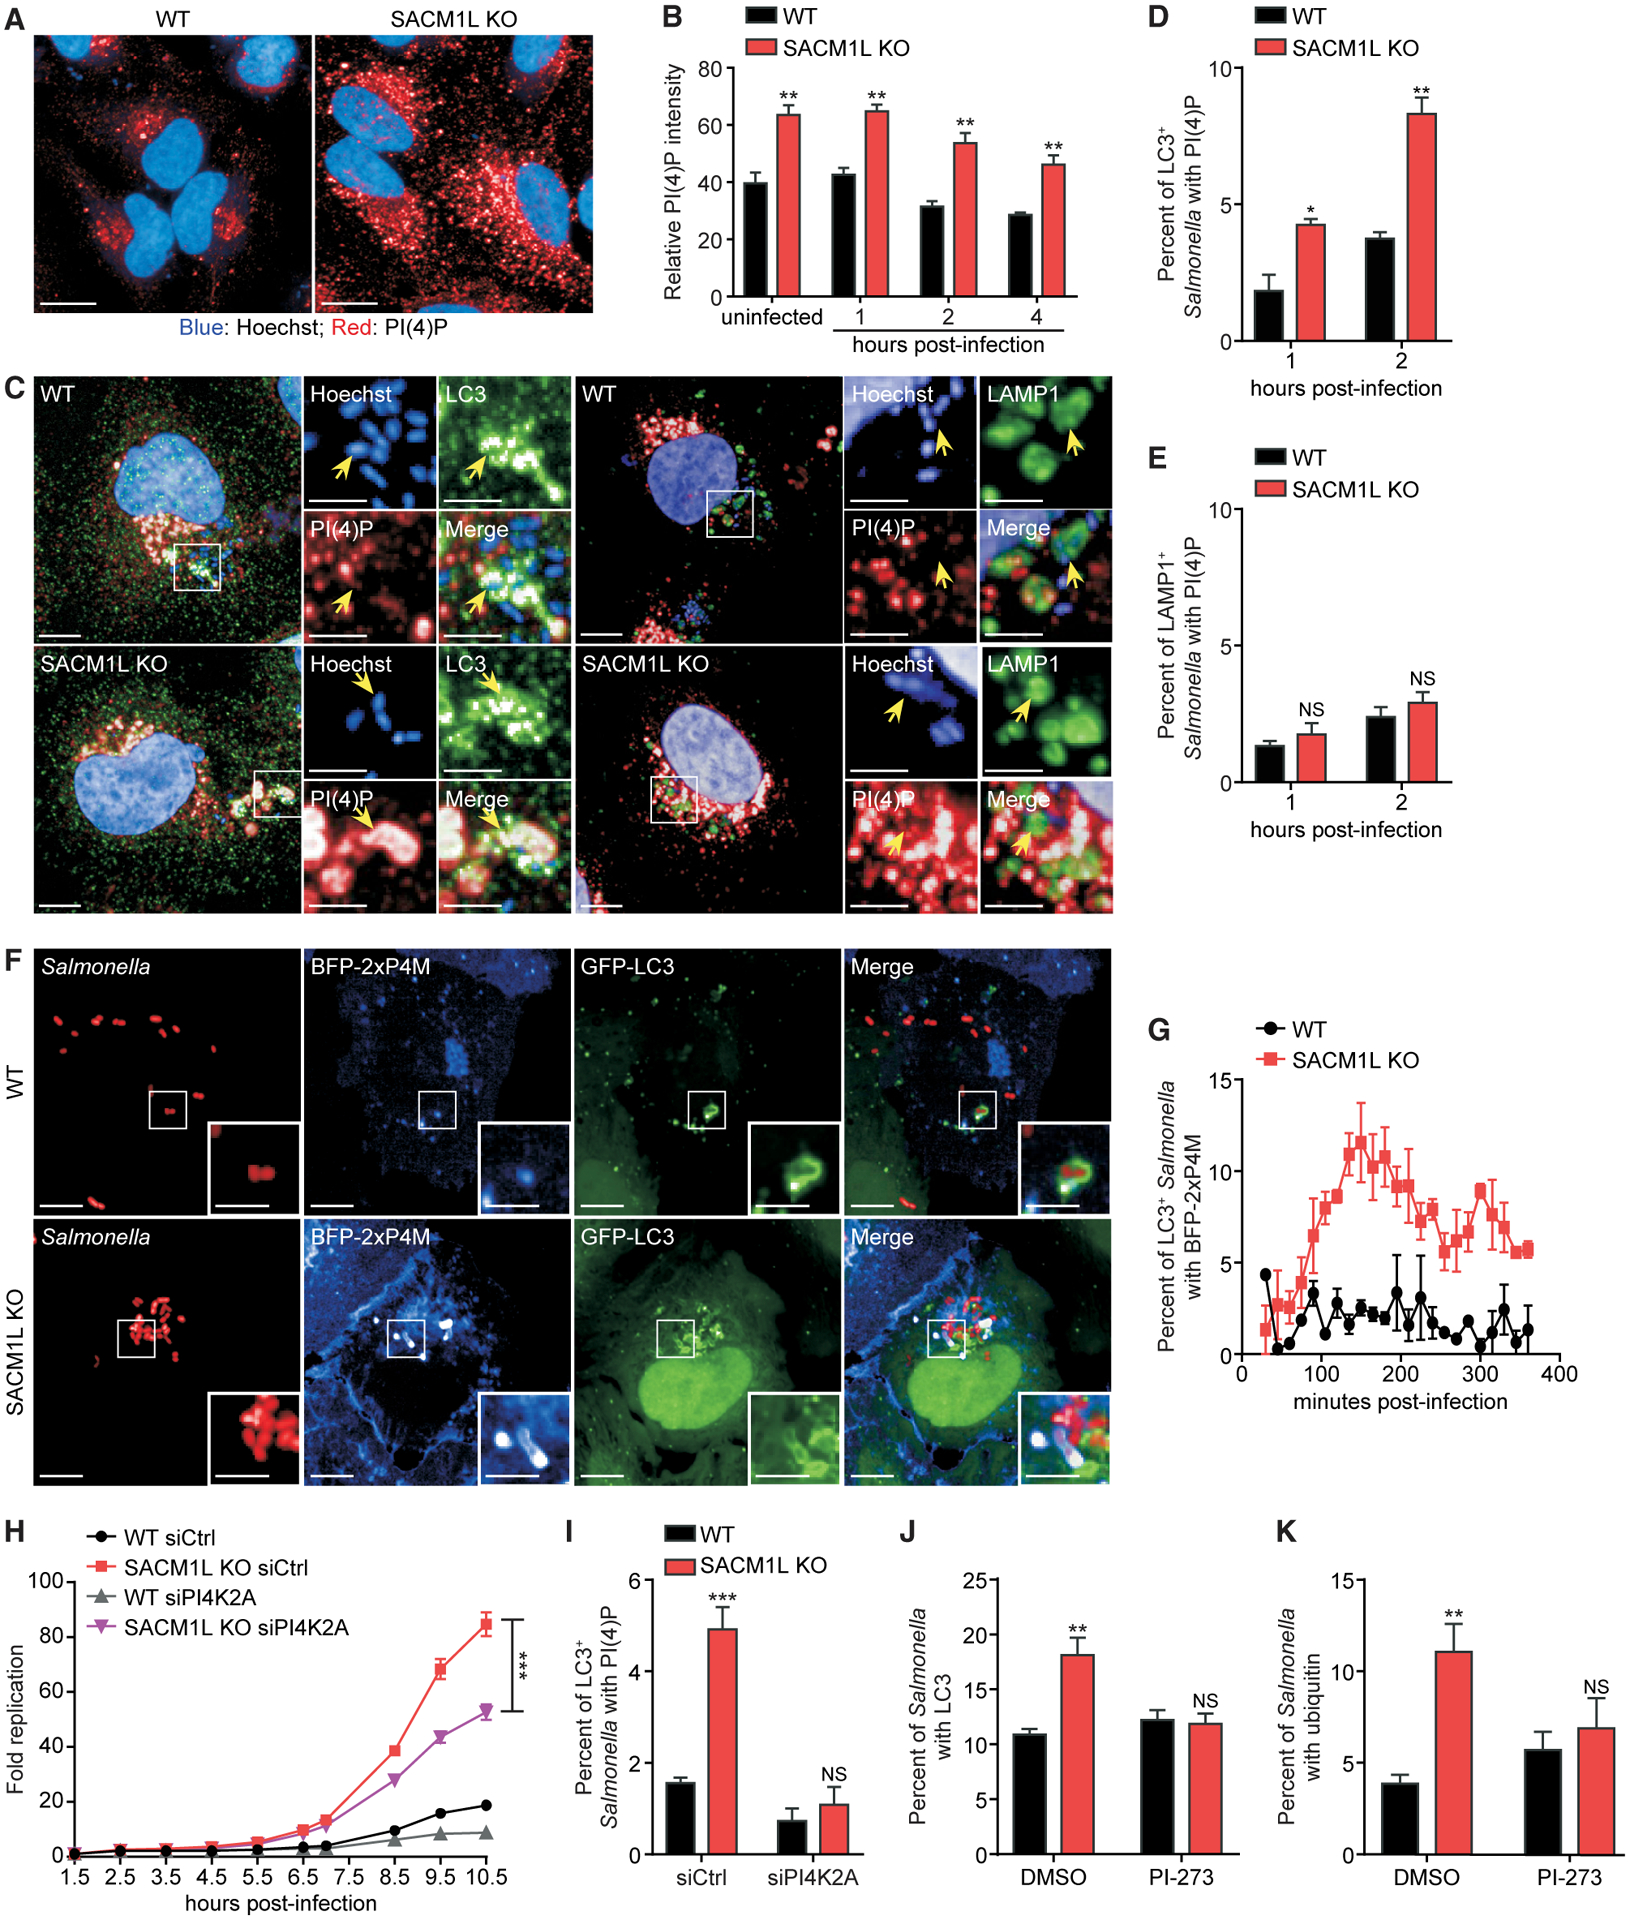
Figure 5. SAC1 regulates PI(4)P levels on Salmonella-containing autophagosomes.

(A) Immunostaining of endogenous PI(4)P in WT and SACM1L KO cells. Hoechst dye shows nuclei. Scale bars represent 20 μm.
(B) Relative PI(4)P staining intensity in uninfected or Salmonella-infected WT and SACM1L KO cells at indicated times post-infection.
(C) Representative confocal images of PI(4)P staining on endogenous LC3+ or LAMP1+ Salmonella in WT and SACM1L KO cells at 2 h post-infection. Insets are boxed regions magnified (2.8×). Hoechst dye shows nuclei and Salmonella. Scale bars represent 10 μm in full images and 5 μm in insets.
(D and E) Percentage of LC3+ (D) or LAMP1+ (E) Salmonella also positive for PI(4)P at indicated times post-infection. For quantification, over 2,000 bacteria were analyzed.
(F and G) Representative confocal images (F) and quantification (G) of co-localization of BFP-2xP4M and GFP-LC3+ Salmonella in WT and SACM1L KO cells. Insets are boxed regions magnified (2.5×). Scale bars represent 10 μm in full images and 5 μm in insets. Data were collected every 15 min for 6 h. For quantification, over 1,000 bacteria were analyzed.
(H) Fold change of luciferase-expressing Salmonella replication in WT and SACM1L KO cells transfected with control or PI4K2ɑ siRNA for 48 h prior to infection. Luciferase levels were measured over time. Bacterial replication was normalized to baseline infection.
(I) Percentage of LC3+ Salmonella associated with PI(4)P in WT and SACM1L KO cells transfected with control or PI4K2ɑ siRNA 48 h prior to infection.
(J and K) Percentage of Salmonella associated with LC3 (J) and ubiquitin (K) in WT and SACM1L KO cells pretreated with DMSO or PI4K2ɑ-specific inhibitor PI-273 (500 nM) for 1 h before infection, then fixed, and stained 2 h after infection. Unless indicated otherwise, over 500 cells were analyzed for quantification. Three independent experiments were analyzed using ANOVA (mean ± SEM). *p < 0.05, **p < 0.01, ***p < 0.001; NS, not significant.
