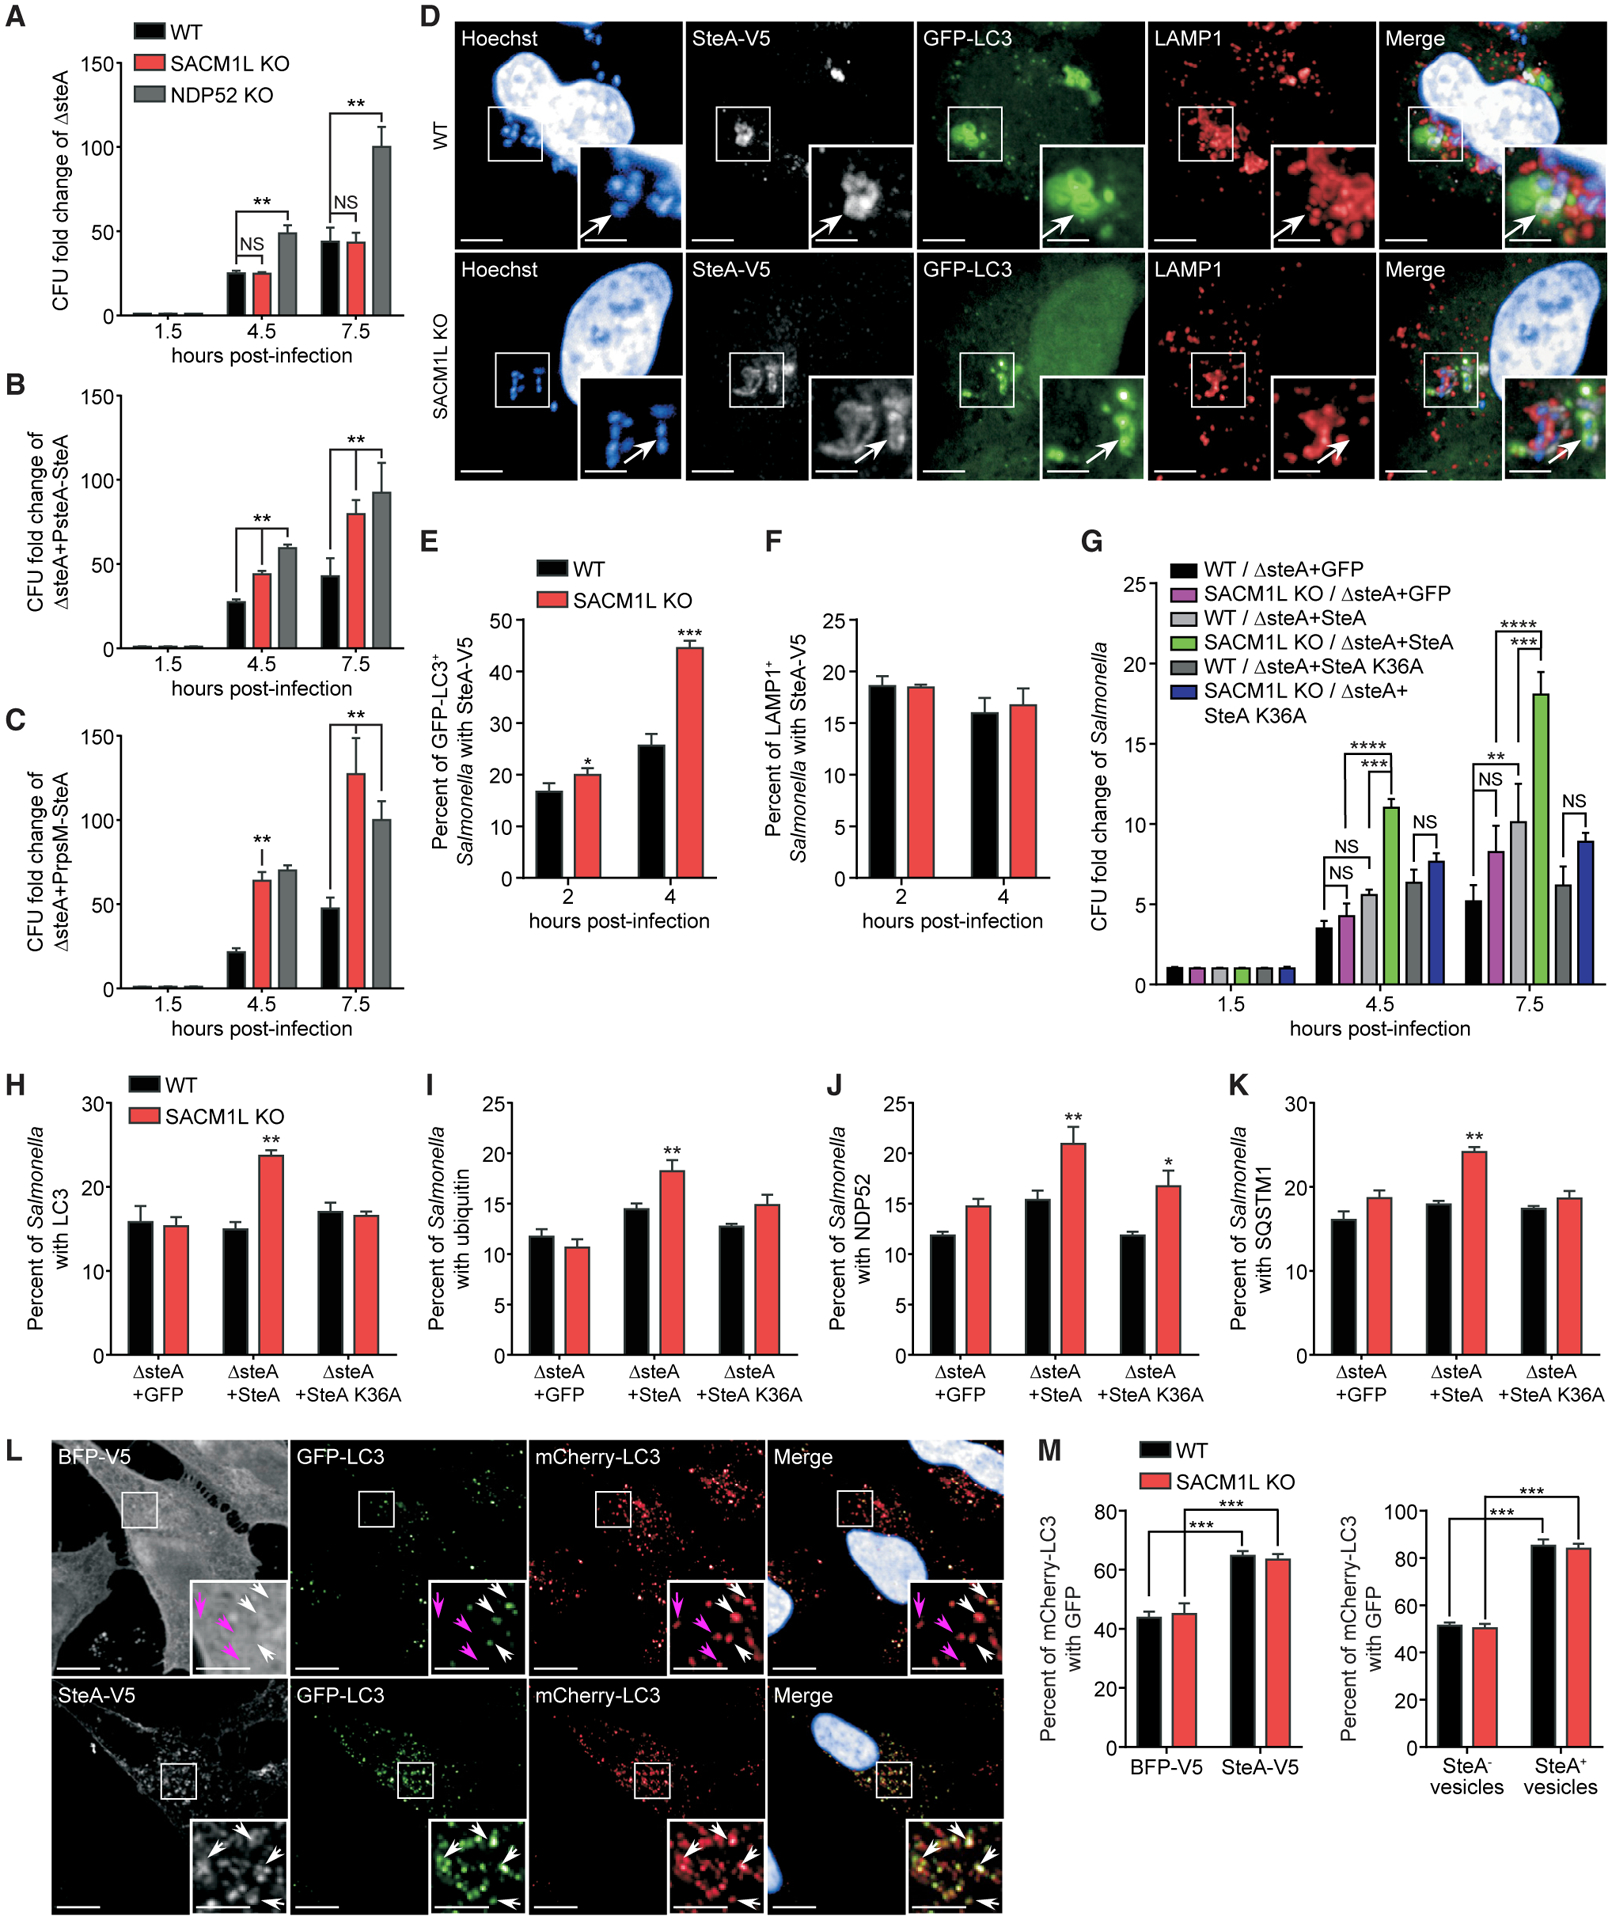
Figure 6. SteA, a Salmonella effector protein, prevents maturation of Salmonella-containing autophagosomes in a PI(4)P-dependent manner.

(A–C) CFU fold change for the ΔsteA mutant (A) and ΔsteA mutant reconstituted with PsteA-SteA (B) or PrpsM-SteA (C) at indicated times post-infection of WT and SACM1L KO cells normalized to the 1.5-h time point.
(D) Representative confocal images of Salmonella associated with SteA-V5 (white arrows) in WT and SACM1L KO cells at 2 h post-infection with ΔsteA reconstituted with SteA-V5. Insets are boxed regions magnified (2×). Scale bars represent 10 μm in full images and 5 μm in insets.
(E and F) Percentage of LC3+ (E) or LAMP1+ (F) Salmonella associated with SteA-V5 at indicated times post-infection.
(G) CFU fold changes normalized to the 1.5-h time points for Salmonella strains at indicated times post-infection of WT and SACM1L KO cells.
(H–K) Percentage of LC3+ (H), ubiquitin+ (I), NDP52+ (J), or SQSTM1+ (K) Salmonella in WT and SACM1L KO cells at 2 h post-infection.
(L and M) Representative confocal images (L) and quantification (M) of mCherry-GFP-LC3 in WT and SACM1L KO cells transiently expressing BFP-V5 or SteA-V5 after 24 h. Hoechst shows nuclei. Scale bars represent 5 μm. Arrows indicate mCherry+GFP+ (white) and mCherry+GFP− (magenta) vesicles. For all quantifications, over 500 cells were analyzed. Three independent experiments were analyzed using ANOVA (mean ± SEM). *p < 0.05, **p < 0.01, ***p < 0.001, ****p < 0.0001; NS, not significant.
See also Figure S6.
