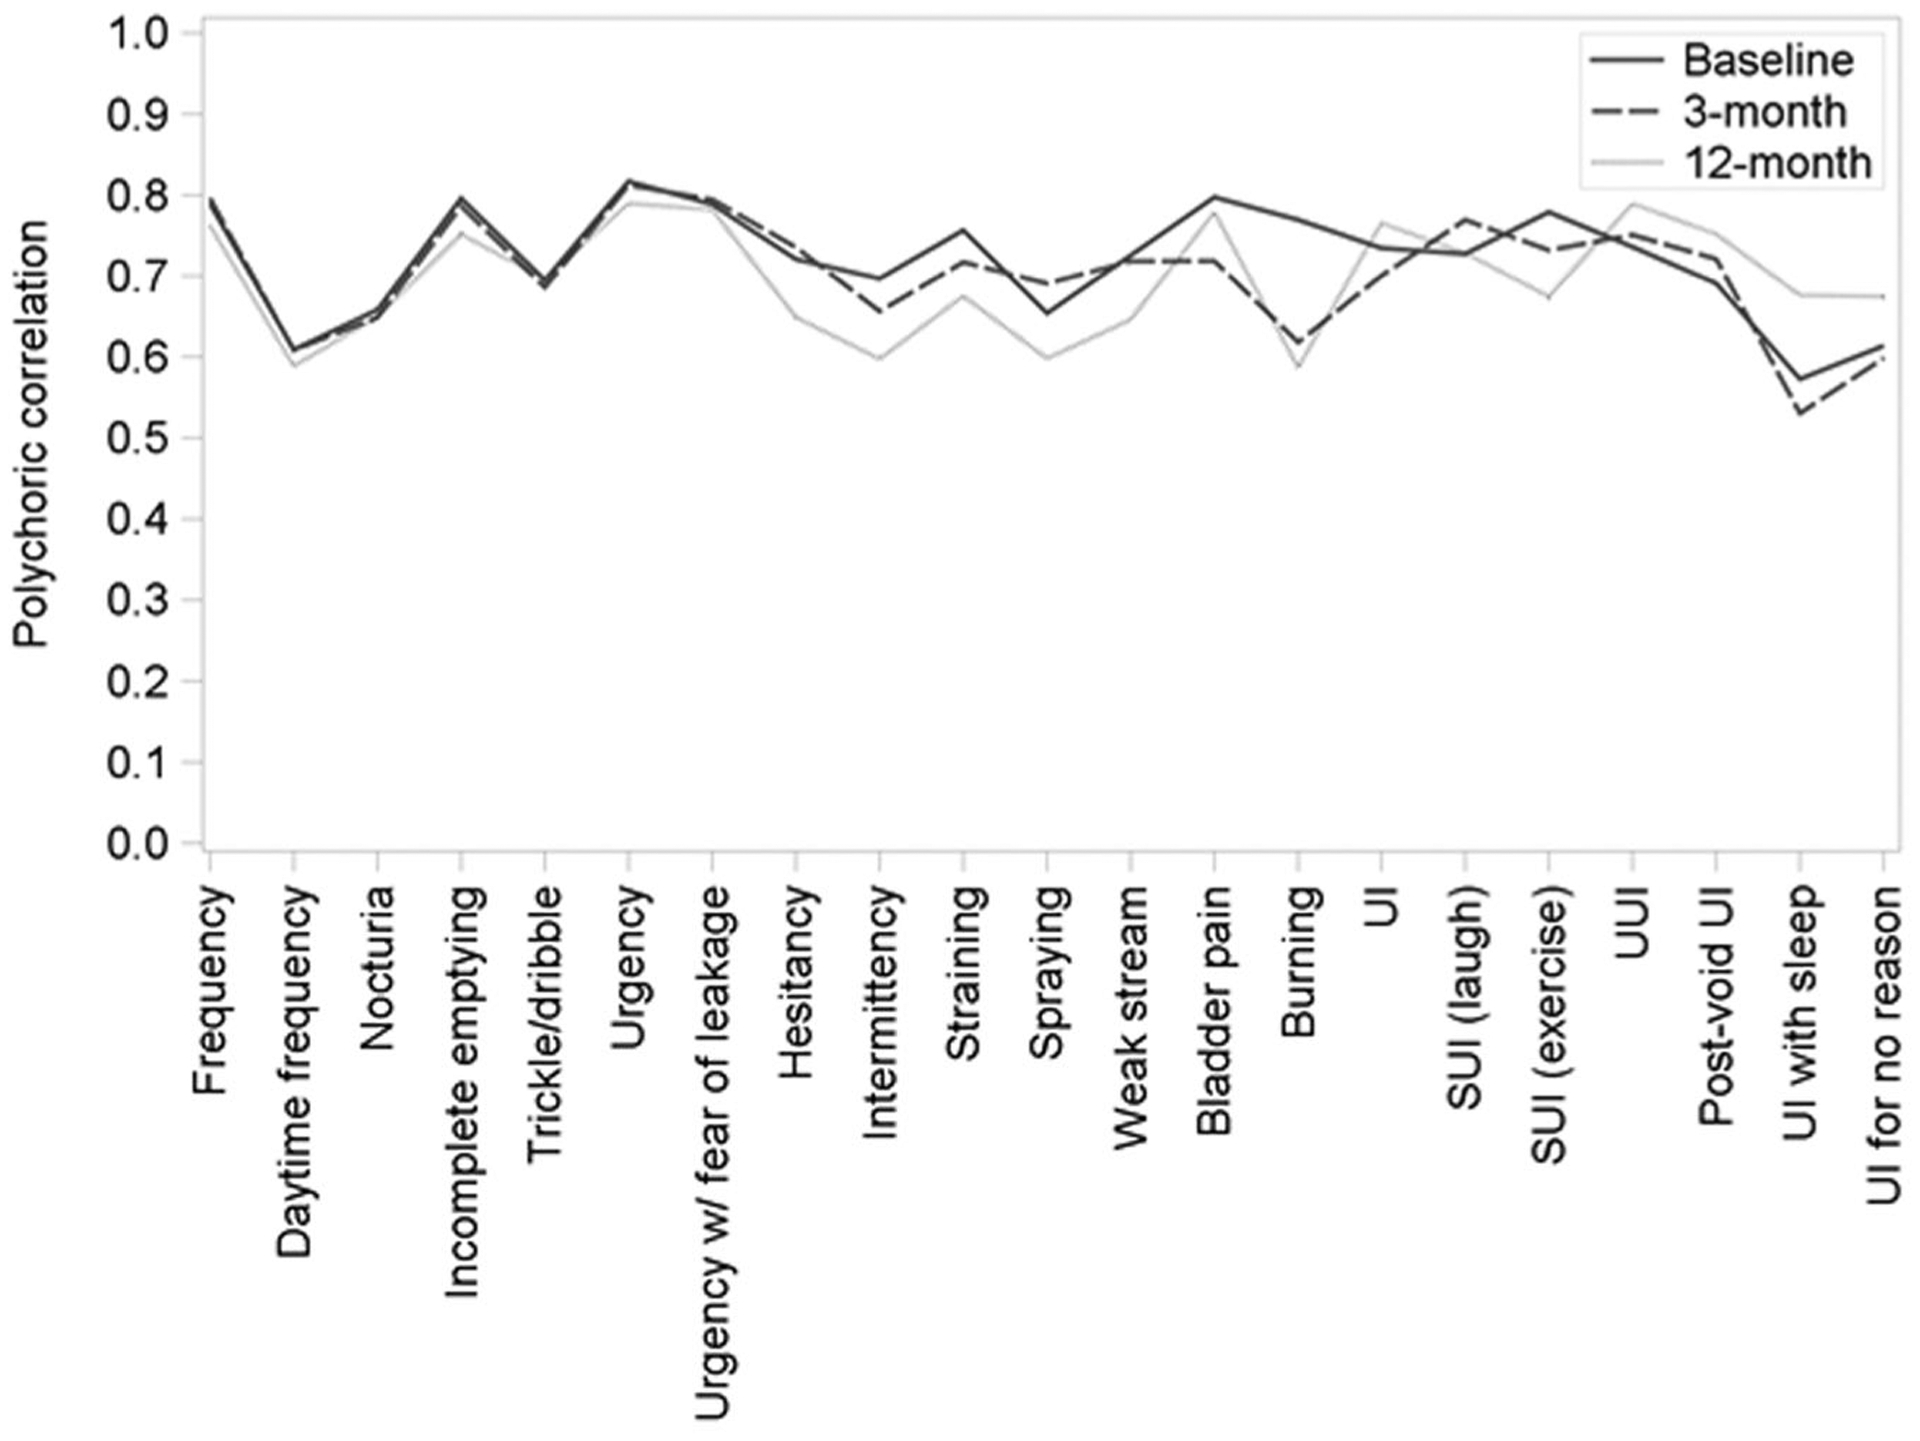
FIGURE 1.

Polychoric correlation coefficients for lower urinary tract symptom (LUTS) tool severity and bother items (imputed data, by timepoint). Line graph of polychoric correlation coefficients for LUTS tool severity and bother items. Each value on the x-axis represents a different LUTS tool question, polychoric correlation values are shown on the y-axis, and each line represents one of the three timepoints (baseline, 3 months, and 12 months). SUI, stress urinary ncontinence; UI, urinary incontinence
