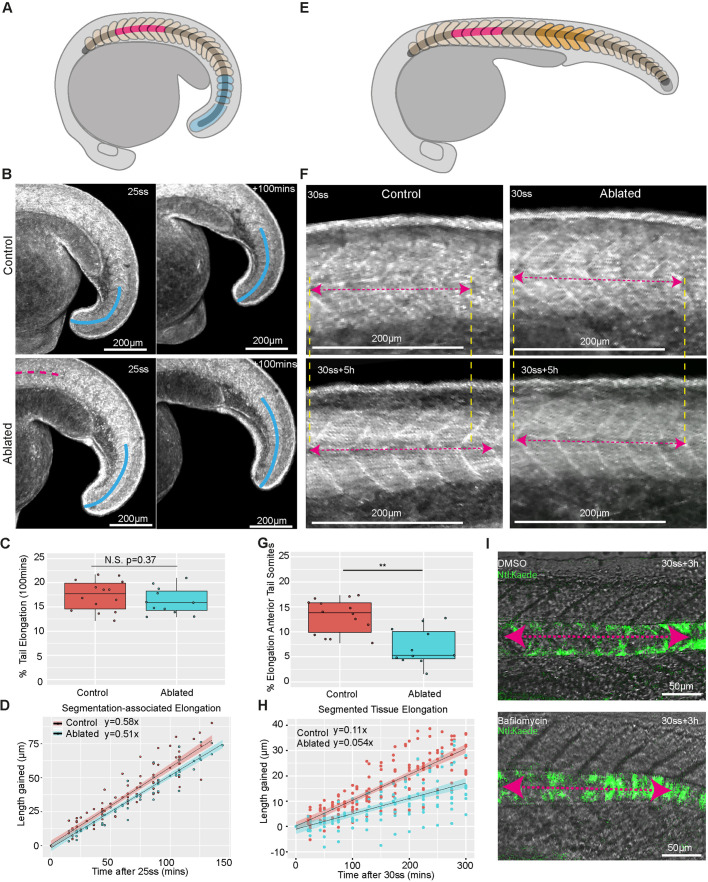
Fig. 3.
Notochord cell expansion contributes to segmented tissue elongation during post-tailbud stages in zebrafish embryos. (A) Schematic showing the ablated region (pink) and region tracked for measuring segmentation-associated elongation (blue) in the developing embryo. (B) Control and ablated LIFEACT-GFP-expressing embryos imaged at the 25ss and 100 min later. Overlaid blue curves show the region tracked for elongation measurements. The pink line indicates the region where the notochord was ablated. (C) Percentage elongation of the tail region in control and ablated embryos (n=14 control embryos, n=11 ablated embryos, P=0.37). N.S., not significant (Mann–Whitney U test). (D) Length gained in the posterior tail of tailbud-stage control and ablated embryos over time. (E) Schematic showing the ablated region (pink) and region tracked for measuring segmented tissue elongation (orange). (F) Elongation of a five-somite region in control and ablated post-tailbud stage LIFEACT-GFP-expressing embryos. Pink dashed arrows indicate the length of the measured region and yellow dashed lines indicate the anterior and posterior extents of the measured region. (G) Percentage elongation of a five-somite region in control and ablated post-tailbud-stage embryos over a period of 5 h (n=14 control and n=11 ablated embryos; **P<0.001, Mann–Whitney U test). (H) Length gained in a five-somite region in control and ablated post-tailbud-stage embryos over time. (I) Length of a five-somite region in representative DMSO and bafilomycin-treated post-tailbud-stage embryos. Pink dashed arrows indicate the length of the measured region.

