
Figure 1.
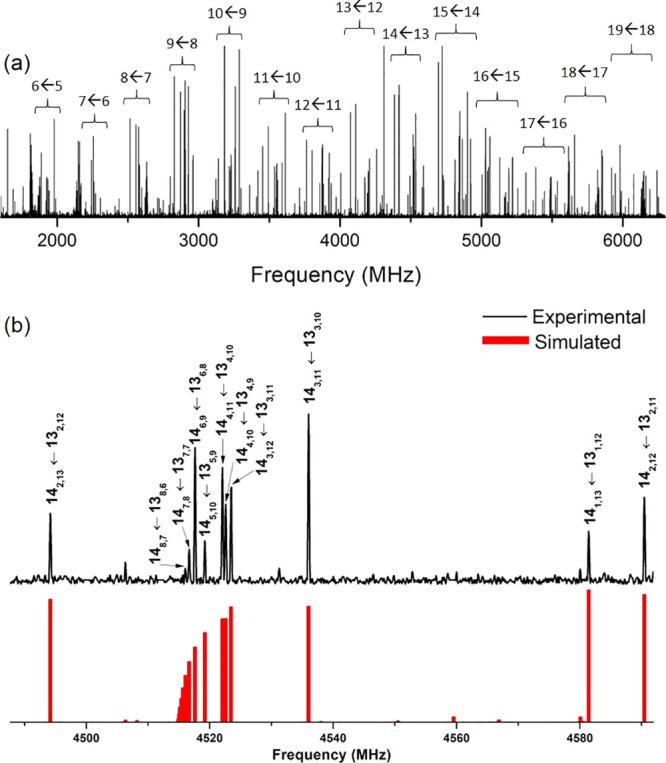
(a) Broadband spectrum of testosterone in the 1.5–6.5 GHz frequency region using the LA-CP-FTMW spectrometer, highlighting the a-type R-branch progressions (J' ← J) originated by a single conformer of testosterone. (b) A comparison between a selected range of the experimental spectrum with the simulated one, with selected rotational transitions (J'´K'a,K'c ← JKa,Kc). As can be seen, there is an excellent agreement between theory and experiment.