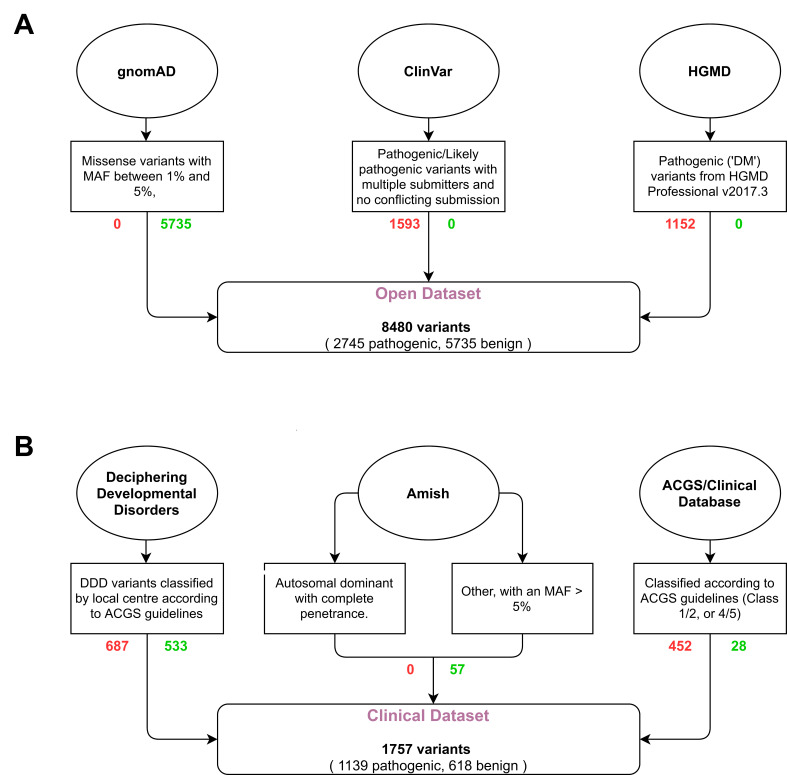
Figure 1.
Flow diagram of selection and filtering steps used for the generation of the open (A) and clinical (B) datasets. Oval—variant source; box—selection criteria; rounded box—dataset. Red text (right) shows the number of pathogenic variants, green text (left) shows the number of benign variants. MAF, minor allele frequency.

