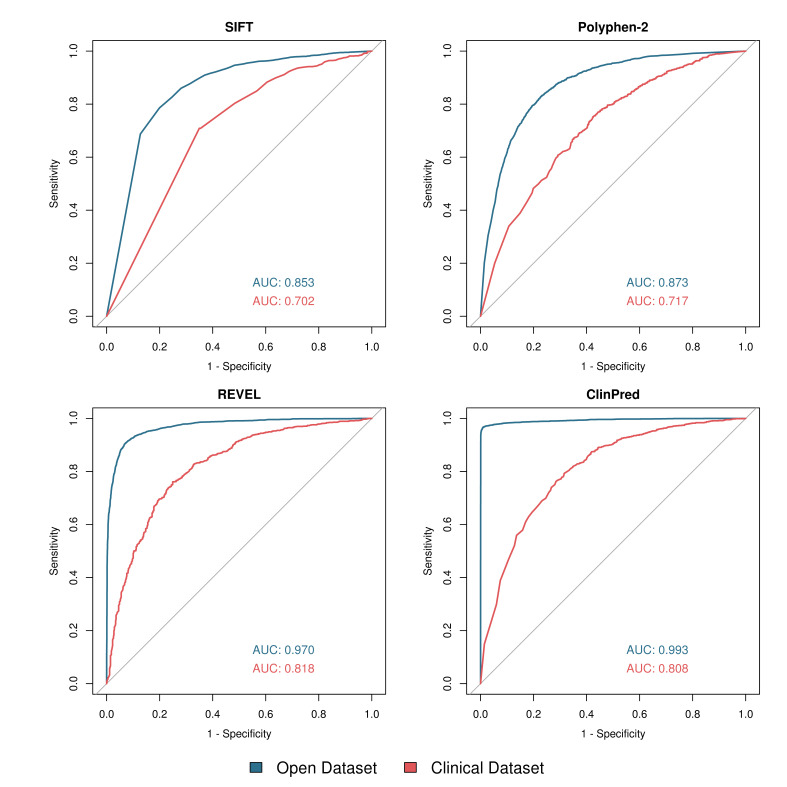
Figure 4.
Receiver operating characteristic (ROC) curves for SIFT, PolyPhen-2, REVEL and ClinPred using two datasets. Open dataset—blue; clinical dataset—red. Generated in R using the ‘roc’ and ‘plot.roc’ functions in the ‘pROC’ library. Area under the ROC curve (AUC) was calculated in R using the ‘roc’ function. For ease of comparison, SIFT scores have been inverted.

