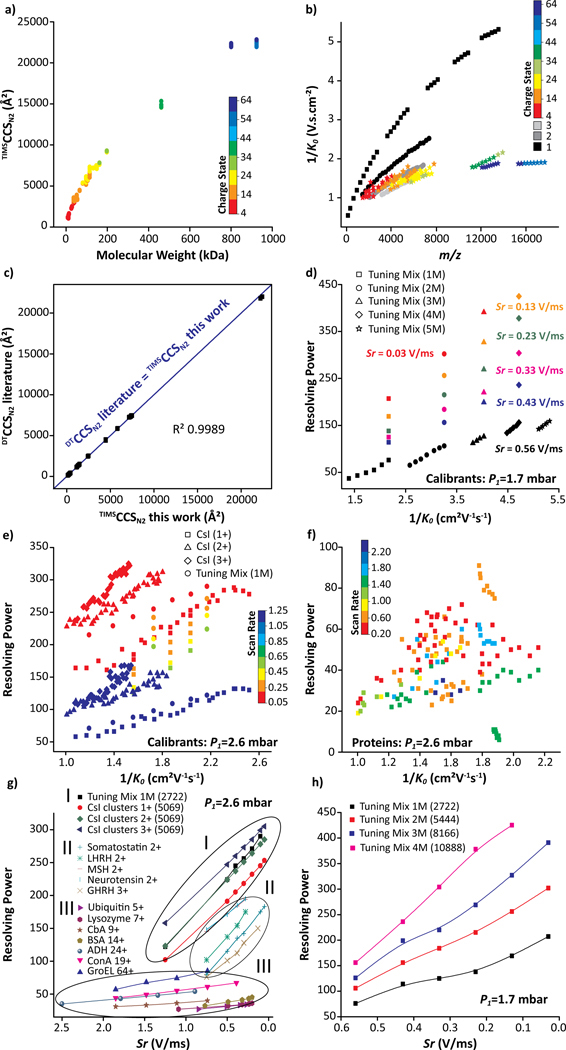
Figure 4.
Plots illustrating the (a) CCS as a function of MW, (b) 1/K0 as a function of m/z for all proteins investigated and (c) comparison of CCSN2 values obtained in this work with literature values obtained from a drift tube using comparable solution conditions (Table S3). The blue linear fit line (R2 = 0.9989) highlights the good agreement between drift tube and convex electrode TIMS geometry. Plots illustrating the resolving power as a function of 1/K0 for (d) calibrants (P1 = 1.7 mbar), (e) calibrants (P1 = 2.6 mbar), (f) protein (P1 = 2.6 mbar) and as a function of Sr for selected species at (g) P1 = 2.6 mbar and (h) P1 = 1.7 mbar.

