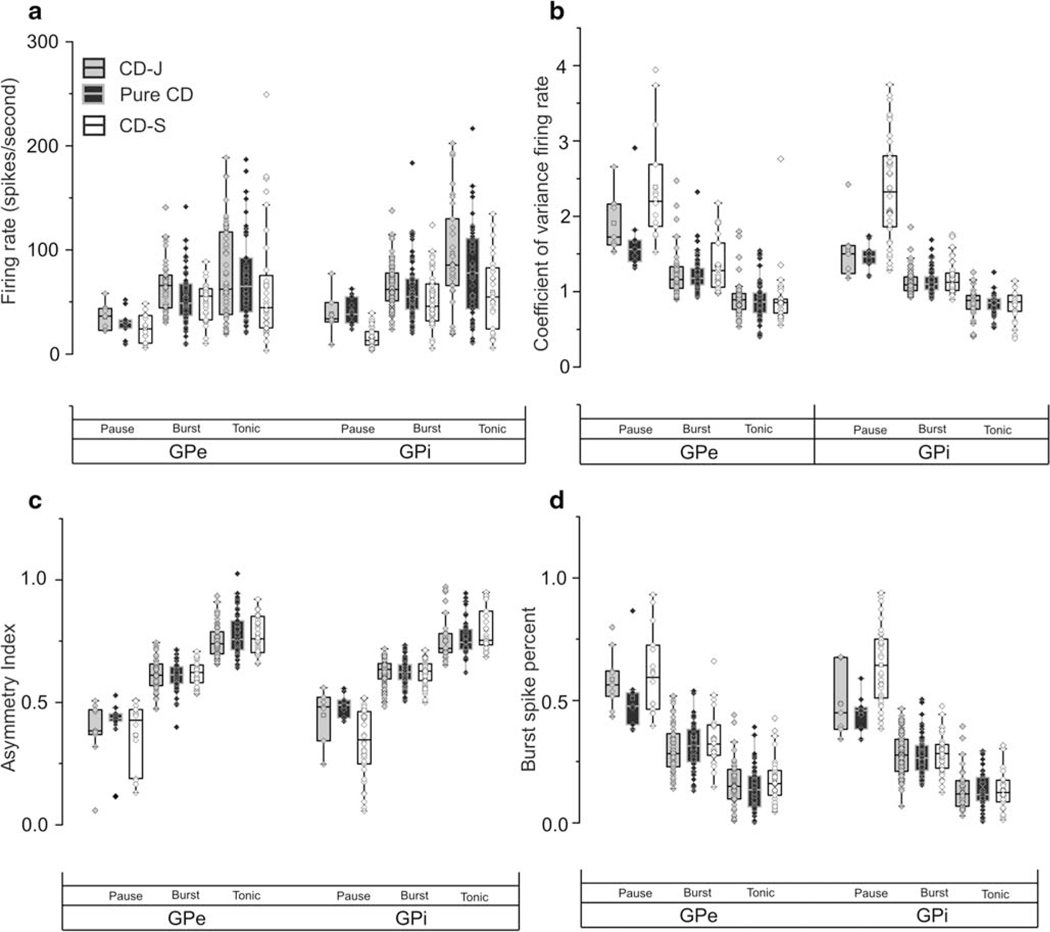
Fig. 4.
Summary of firing rate (A), coefficient of variance of the firing rate (B), asymmetry index (C), and burst spike percent (D) in pause, burst and tonic neurons recorded from GPi and GPe. The values of corresponding parameter are plotted on y-axis, while axis is category. Box length is interquartile interval, the dashed line in the center of the box is median value, while whisker is the range, symbols depict each single-unit

