Figure 4.
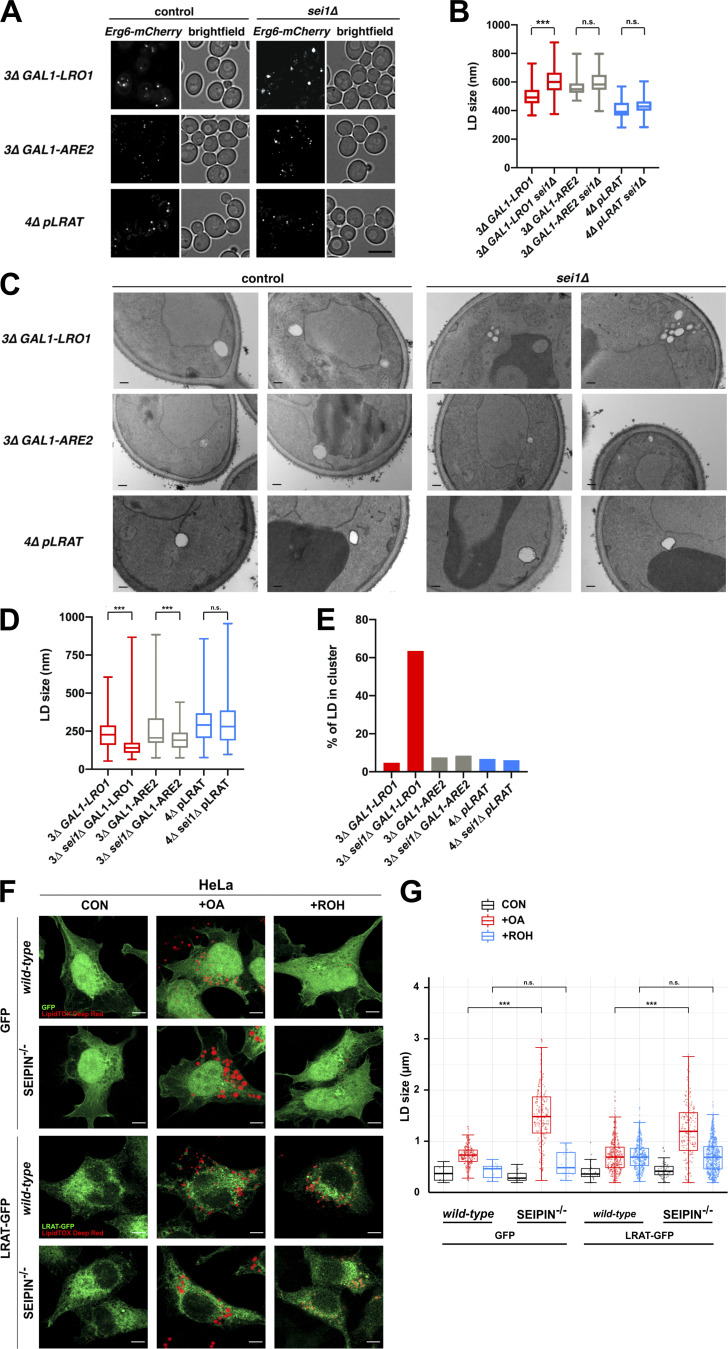
Seipin deletion does not alter the size or clustering of RE-filled LDs. (A) Fluorescence microscopy images of yeast strains with (control) or without (seiΔ1) seipin and expressing the LD marker Erg6-mCherry. Cells were grown in SC medium with raffinose. TAG or SE production was induced by adding galactose to the 3Δ GAL1-LRO1 and 3Δ GAL1-ARE2 cells. These strains were imaged 4 and 6 h after galactose addition, respectively. 4Δ pLRAT cells were grown in SC medium and imaged 2 h after the addition of ROH. Full-projection images are shown from Z-stacks of 20 deconvolved images. Scale bars indicate 5 µm. (B) Quantification of LD diameters from the conditions in A (at least 100 LDs per condition from three independent experiments). Statistical significance was determined by Student’s t test. (C) EM images of the same conditions as in A. Scale bars indicate 200 nm. (D) Box plots with quantified LD diameters from the conditions in C (number of LDs counted: 3D GAL1-LRO1, n = 213; 3Δ sei1Δ GAL1-LRO1, n = 358; 3Δ GAL1-ARE2, n = 219; 3Δ sei1Δ GAL1-ARE2, n = 220; 4Δ pLRAT, n = 185; 3Δ sei1Δ pLRAT, n = 203). Statistical significance was determined by Mann-Whitney tests of two independent experiments. (E) Percentage of LDs present in clusters containing three or more LDs, based on the LD quantification shown in D. (F) Fluorescence microscopy images of WT and seipin−/− HeLa cells transiently expressing GFP (top) or LRAT-GFP (bottom, both shown in green), incubated with medium control, 100 µM OA, or 10 µM ROH. LDs are visualized in red (LipidTOX Deep Red). Scale bars indicate 10 µm. (G) Quantification of LD diameters from the conditions in F (number of LDs counted in the respective conditions: n = 6, 220, 12, 14, 213, 16, 24, 351, 387, 54, 170, 627). CON, control; +OA, +oleic acid; +ROH, +retinol. Statistical significance was determined by Mann-Whitney test of one representative experiment. ***, P < 0.001.

