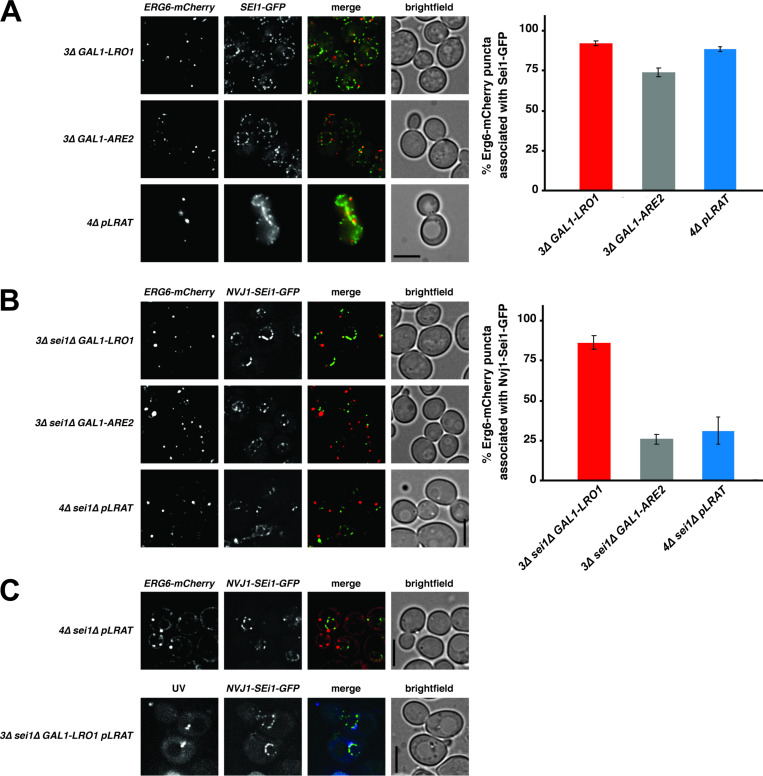
Figure 5.
Seipin does not determine the biogenesis site of LDs filled with RE or SE. (A–C) Fluorescence microscopy images of yeast strains expressing Erg6-mCherry (left panels) and Sei1-GFP (A, middle panels) or Nvj1-Sei1-GFP (B and C, middle panels). (A and B) Cells were grown as described in Fig. 4 A to induce the production of TAG, SE, or RE. Bar graphs (A and B) show the percentage of LDs (Erg6-mCherry puncta) associated with Sei1-GFP (A) or Nvj1-Sei1-GFP (B) foci. Graphs show mean ± SD from 100 cells (3 independent experiments). (C) Cells were grown in SC medium with raffinose. After the addition of galactose and 60-min incubation, ROH was added, and cells were grown for an additional 10 min and imaged. RE-containing LDs were visualized by UV autofluorescence. All microscopy images are full projections of single, deconvolved images from 20-image Z-stacks. Scale bars indicate 5 µm.

