Figure 1.
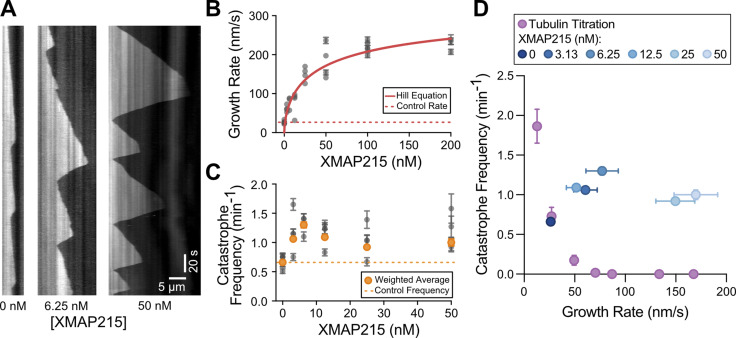
XMAP215 simultaneously increases microtubule growth rate and catastrophe frequency in the presence of EB1. (A) Representative kymographs of microtubule plus ends grown with 20 µM tubulin, 200 nM EB1-GFP, and corresponding amount of XMAP215 (nM). Tubulin signal is shown. (B and C) Quantification of microtubule growth rate (B) and catastrophe frequency (C) as a function of XMAP215 concentration in the presence of 20 µM tubulin and 200 nM EB1-GFP. Error bars, SEM and SE, respectively. Each point represents 20 kymographs from one experimental repeat. Number of experimental repeats per concentration, 6, 4, 3, 4, 4, 4, and 3. Dotted lines indicate the average control values (0 nM XMAP215). Solid red line in B, fit to the Hill equation. Orange points in C, weighted averages for each condition. (D) Average catastrophe frequency (from C) replotted as a function of average growth rate (from B) for the XMAP215 titration along with the tubulin titration (Fig. S1 B).

