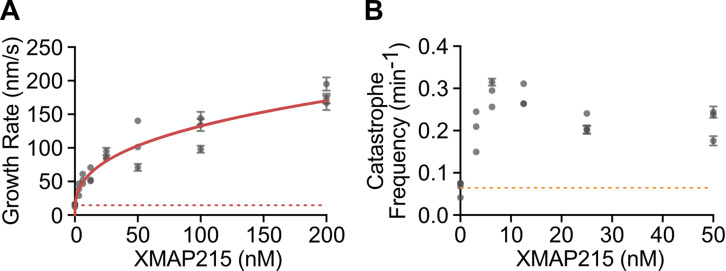
Figure S2.
XMAP215 alone promotes simultaneous increase of microtubule growth rate and catastrophe frequency. (A and B) Quantification of microtubule growth rate (A) and catastrophe frequency (B) as a function of XMAP215 concentration in the presence of 10 µM tubulin. Error bars, SEM and SE, respectively. Each point represents values measured for 20 kymographs from one experimental repeat. Number of experimental repeats per concentration, 4, 3, 3, 3, 3, 3, 3. Dotted lines indicate the average values for the control (0 nM XMAP215). Solid red line in A is the data fit to the Hill equation.

